

Summary
For EHS leaders and plant decision-makers navigating CPCB audits, consent renewals, or rising fenceline compliance pressure across refineries, petrochemical plants, and heavy industrial operations, this guide provides a practical operational roadmap.
Fenceline monitoring compliance requires continuous emission monitoring to ensure that pollutants released beyond the facility boundary remain within threshold limits, including fugitive emissions that fixed-stack instrumentation often fails to capture. In fact, fugitive emissions from a refinery can account for over 60% of the facility's total VOC emissions. The US-EPA requires refineries to monitor benzene at the fenceline, with an annual average of 9 µg/m3 as the action level under the Clean Air Act. In India, the CPCB requires Continuous emission monitoring systems (CEMS) to be installed in 17 highly-polluting industries, where the maximum standards for SO2 and NO2 are 80 µg/m3 (24-hr average).
Failure to comply can result in multiple consequences, including heavy fines, a halt in operations, revocation of permits, and increased scrutiny by regulatory agencies. That’s why leading facilities now treat fenceline monitoring as operational infrastructure for daily risk control, and not just a reporting requirement.
Introduction
Emissions are not confined to boundaries, nor is accountability. The trend towards accountability for environmental performance is growing as organizations recognize the value of transparency to their customers, communities, investors, and internal governance systems. One of the prominent actions related to this shift is fenceline monitoring: measuring air pollutants at a facility’s perimeter to track how much pollution is leaving the site. What was once considered a best practice is now a worldwide requirement. Facilities that treated it as an optional best practice are now lagging on compliance and have lost community trust.
What is Fenceline Monitoring Compliance?
Fenceline monitoring measures cumulative pollutant concentrations at a facility’s boundary, capturing fugitive emissions that stack monitoring of single controlled sources often misses. Fenceline monitoring involves regular or continuous air-quality monitoring at the boundary to ensure the facility's emissions comply with limits.
The difference between fenceline and stack monitoring is that it only measures controlled point-source emissions, leaving fugitive emissions, equipment leaks, or unintentional discharges. According to the EPA, fugitive emissions account for 60% or more of total VOC emissions at some refineries, making fenceline monitoring essential for understanding a facility’s true off-site emissions impact.
From a regulatory standpoint, fenceline monitoring data allow regulators to assess actual community-level exposure. Since fenceline monitoring captures a complete emissions picture, regulators can make faster compliance determinations and defend them with greater confidence. In addition, fenceline monitoring provides facility owners with information to identify emission sources, validate pollution controls, and enable proactive responses to elevated emissions before a violation occurs.
Why Fenceline Monitoring is No Longer Optional
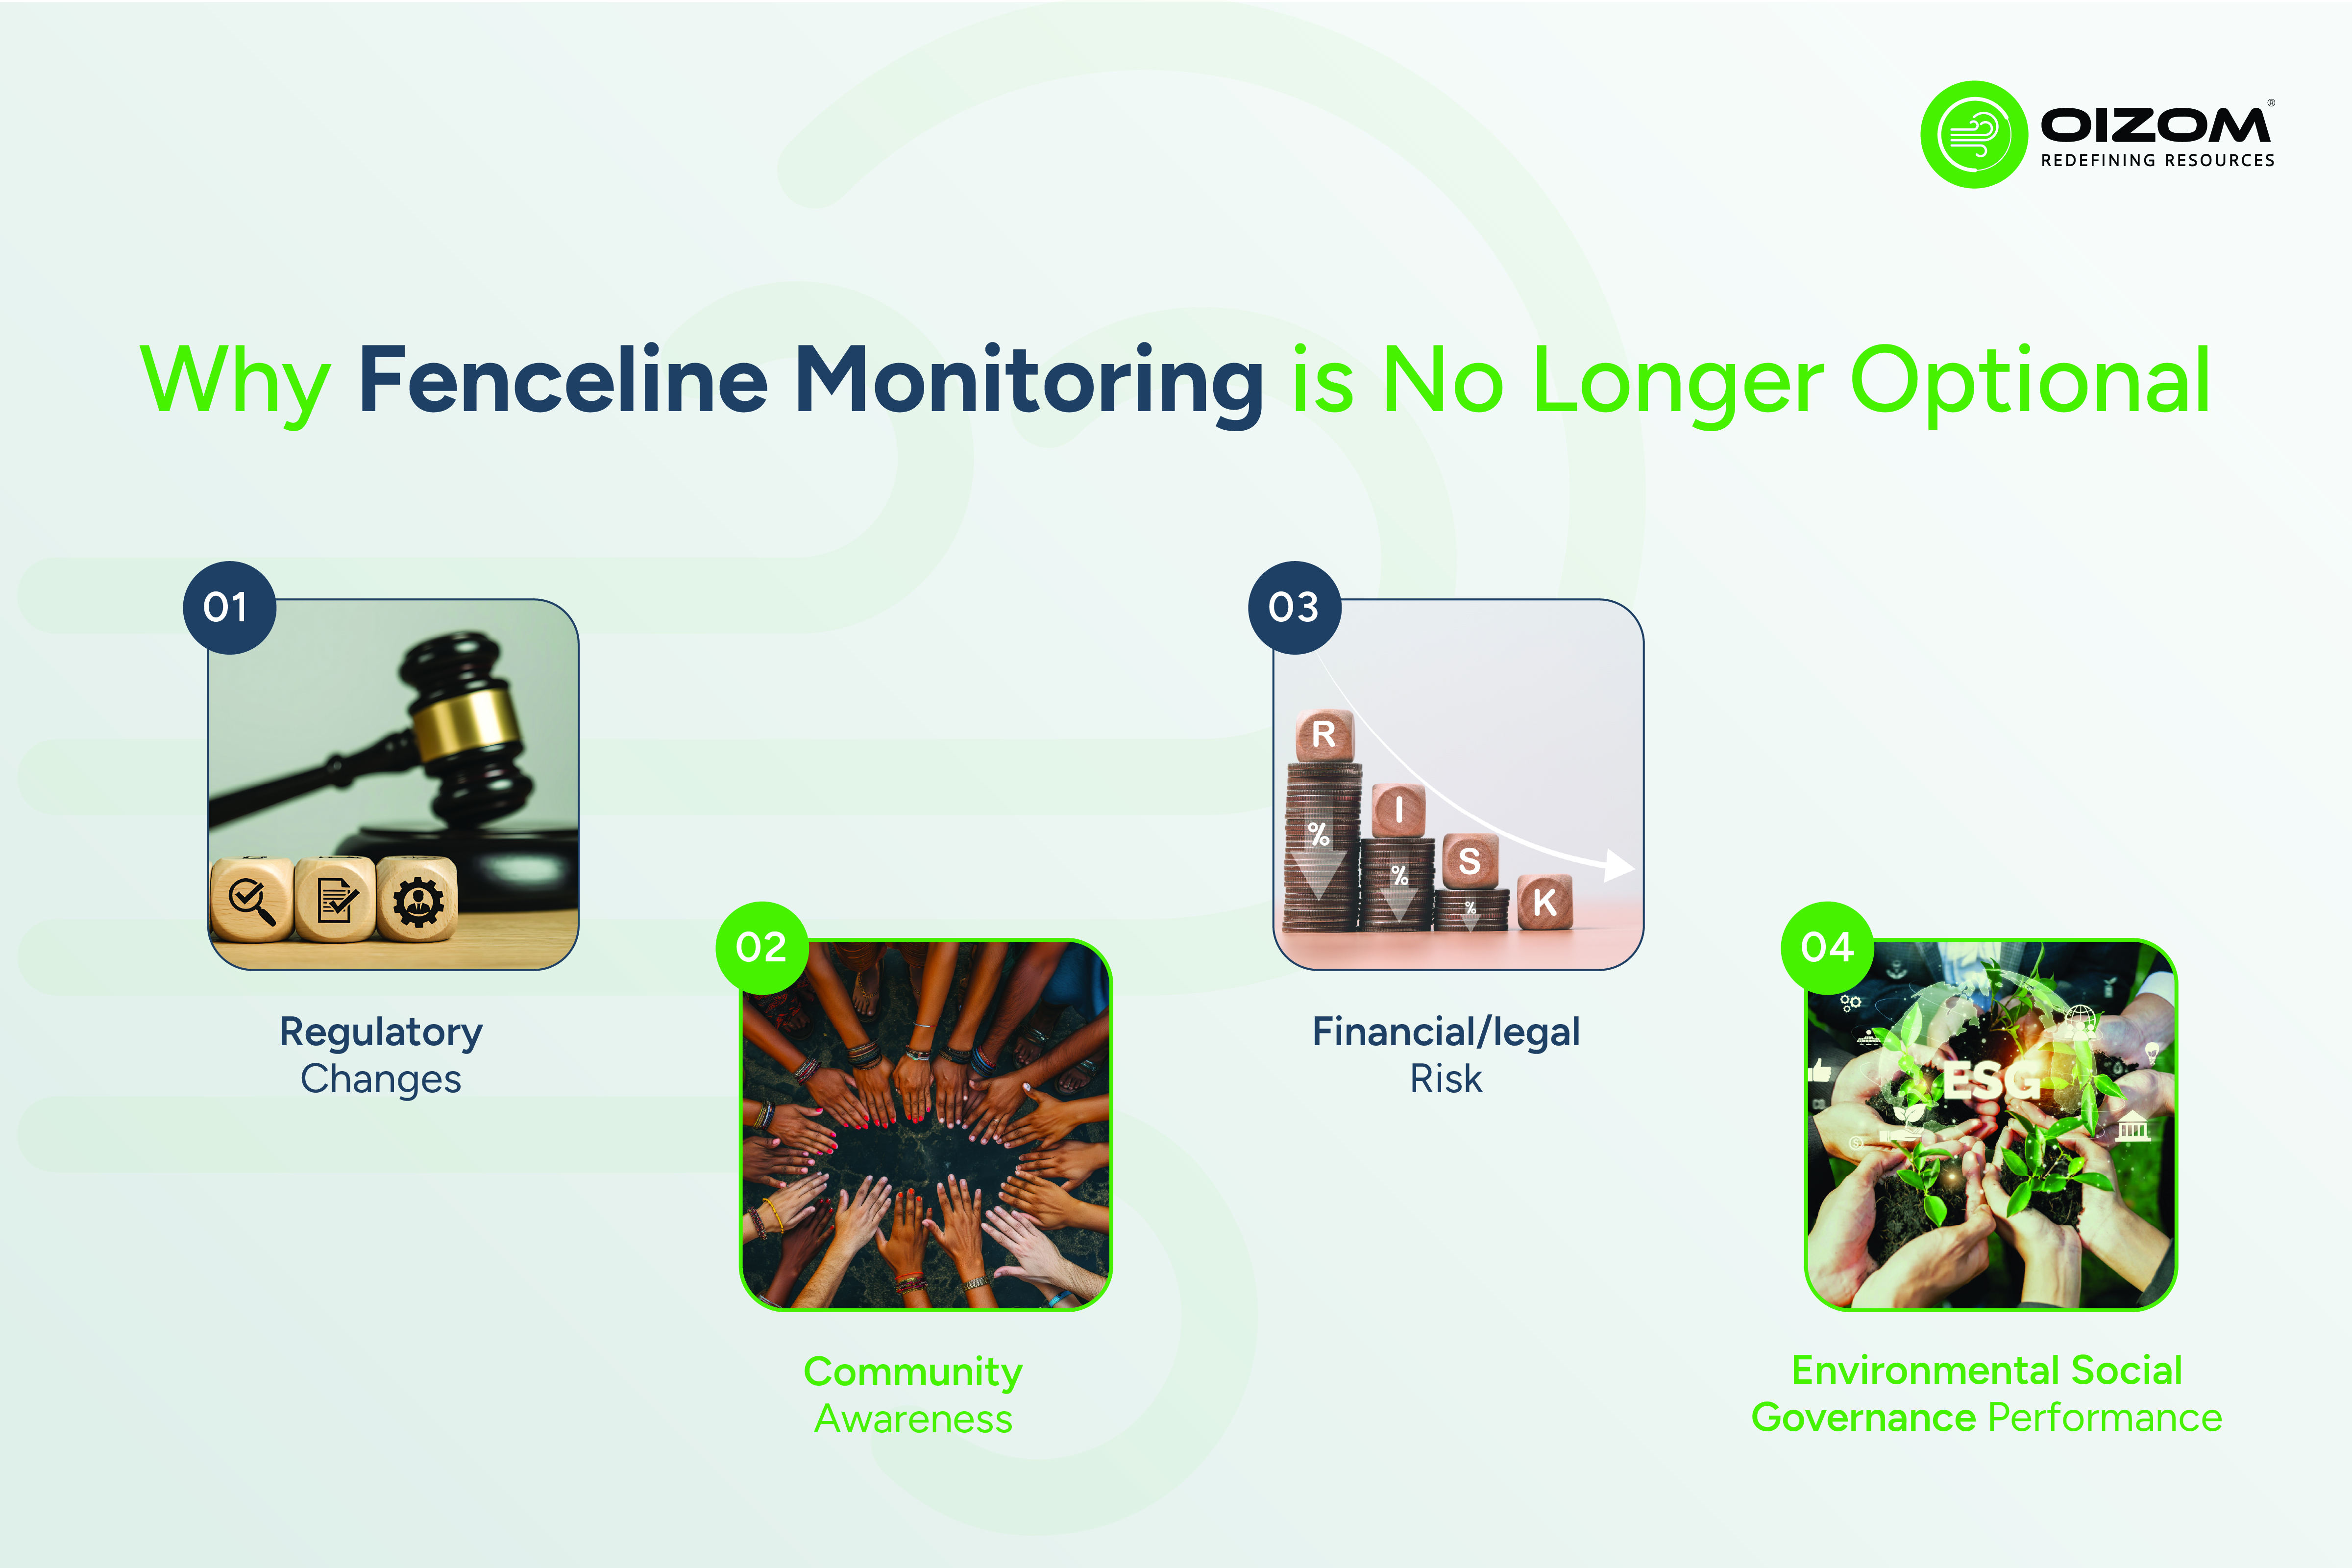
Fenceline monitoring has transitioned from being optional to mandatory due to several factors:
1. Regulatory Changes
Globally, regulatory agencies have updated air quality regulations, including stricter fenceline air-monitoring requirements, and will require companies to conduct more extensive monitoring of air emissions beyond smokestacks.
2. Community Awareness
Communities near industrial facilities are better informed than ever and increasingly vocal. Platforms for public reporting, citizen science tools, and real-time AQI trackers mean that a spike in emissions at your fenceline can surface publicly before your internal team is even aware of it.
3. Financial/legal Risk
Companies that are determined to violate regulations are at risk of:
- Fines/penalties
- Mandated shutdowns
- Prosecution
- Loss of reputation
4. Environmental Social Governance (ESG) and Institutional Investor Pressure
Environmental Performance is now part of the Investment Decision, and monitoring data will also be included in an organization's sustainability report. Investors and ESG rating agencies are increasingly treating continuous monitoring data as a proxy for operational discipline, not just environmental intent.
Key Regulations Driving Fenceline Monitoring Compliance
Many requirements vary across regions worldwide; however, industry-specific guidelines and key regulatory frameworks have provided overall guidance on fenceline air monitoring regulations and how they operate globally.
United States (EPA)
Fenceline monitoring (e.g., benzene fenceline monitoring near refineries) for specific pollutants is required under the Clean Air Act. Fenceline monitoring (e.g., benzene near refineries) is required under the Clean Air Act, with a defined action level of 9 µg/m³ (annual average) that exceeds the trigger for mandatory investigation and corrective action.
European Union
The IED requires continuous monitoring and has imposed stricter emission limits in various ways. The Industrial Emissions Directive (IED) enforces permit-specific emission limits based on Best Available Techniques (BAT), with monitoring requirements defined at the facility level.
India and Emerging Economies
The CPCB has progressively tightened continuous emissions monitoring requirements for 17 highly polluting industry categories, increasing compliance expectations across India’s industrial sector. States such as Gujarat, Maharashtra, and Tamil Nadu have stepped up enforcement of existing laws by implementing fenceline monitors in all large industrial neighborhoods and increasing inspections. The CPCB has ambient standards for SO₂ and NO₂ of less than 80 µg/m³ and is also increasing enforcement of continuous emissions monitoring across all industrial sectors in all states.
Worldwide Frameworks
ESG frameworks (e.g., GRI, SASB) do not define thresholds but increasingly require consistent, auditable emissions data, pushing companies toward continuous monitoring and disclosure.
Regulatory Comparison Table
| Region | Regulation Name | Key Pollutants Covered | Monitoring Frequency Required | Penalty for Non-Compliance |
| United States | Clean Air Act (EPA – Benzene Fenceline Monitoring Rule) | Benzene (primary), VOCs | Continuous (typically 2-week rolling averages reported quarterly) | Monetary fines, consent decrees, operational restrictions, potential shutdowns |
| European Union | Industrial Emissions Directive (IED) | VOCs, NOx, SO₂, PM, HAPs (varies by permit) | Continuous or periodic (depending on permit and pollutant) | Fines, permit suspension, stricter future limits, and enforcement actions by member states |
| India | CPCB Guidelines for Continuous Emission Monitoring Systems (CEMS) & State-Level Directives | PM, SO₂, NOx, VOCs (including benzene in petrochemical zones) | Continuous monitoring for major industries (especially highly polluting sectors) | Fines, plant closure notices, disconnection of utilities, legal action |
| Global / ESG Frameworks | ESG Reporting Standards (e.g., GRI, SASB) | Broad: VOCs, GHGs, PM, site-specific pollutants | Periodic reporting (annual), with increasing shift toward continuous data disclosure | Reputational damage, investor pressure, and reduced access to capital |
India Focus: How Fenceline Monitoring Fits into the Regulatory Landscape
Fenceline monitoring in India is growing as an integral component of various compliance mechanisms, led primarily by the CPCB at the national level and various SPCBs at the state level.
The CPCB has identified 17 highly polluting industry categories that will be subject to more robust compliance monitoring, including CEMS. As part of this framework, the Comprehensive Environmental Pollution Index (CEPI) policy also drives how strictly PCBs enforce compliance with the industries they regulate. PCBs will scrutinize industrial centers with high CEPI scores more closely, require compliance with a mandatory action plan, and require continuous data reporting to the PCB to ensure regulatory compliance.
For example, Gujarat and Maharashtra have taken the additional step of implementing a real-time monitoring program and conducting industry inspections, while increasing the consequences of non-compliance by shifting from periodic reporting to continuous data transparency and public availability.
This shift also aligns with broader national air-quality initiatives such as the National Clean Air Programme (NCAP), which targets particulate matter reduction across Indian cities, alongside increasing use of National Air Quality Index (NAQI) data and state-level clean air action plans to track ambient air quality trends and guide regulatory oversight.
Under these new and emerging regulatory standards and government programmes, fenceline monitoring is therefore also an expected and natural evolution of those same compliance measures, and it is increasingly becoming part of the broader compliance framework established by the CPCB for the following types of activities:
- Consent to Establish (CTE) approvals
- Consent to Operate (CTO) renewals
- Site-specific directives in high-risk industrial zones
In practice, even where not formally required, fenceline monitoring is becoming essential for demonstrating compliance and managing environmental risk.
What Pollutants Need to Be Monitored at the Fenceline?
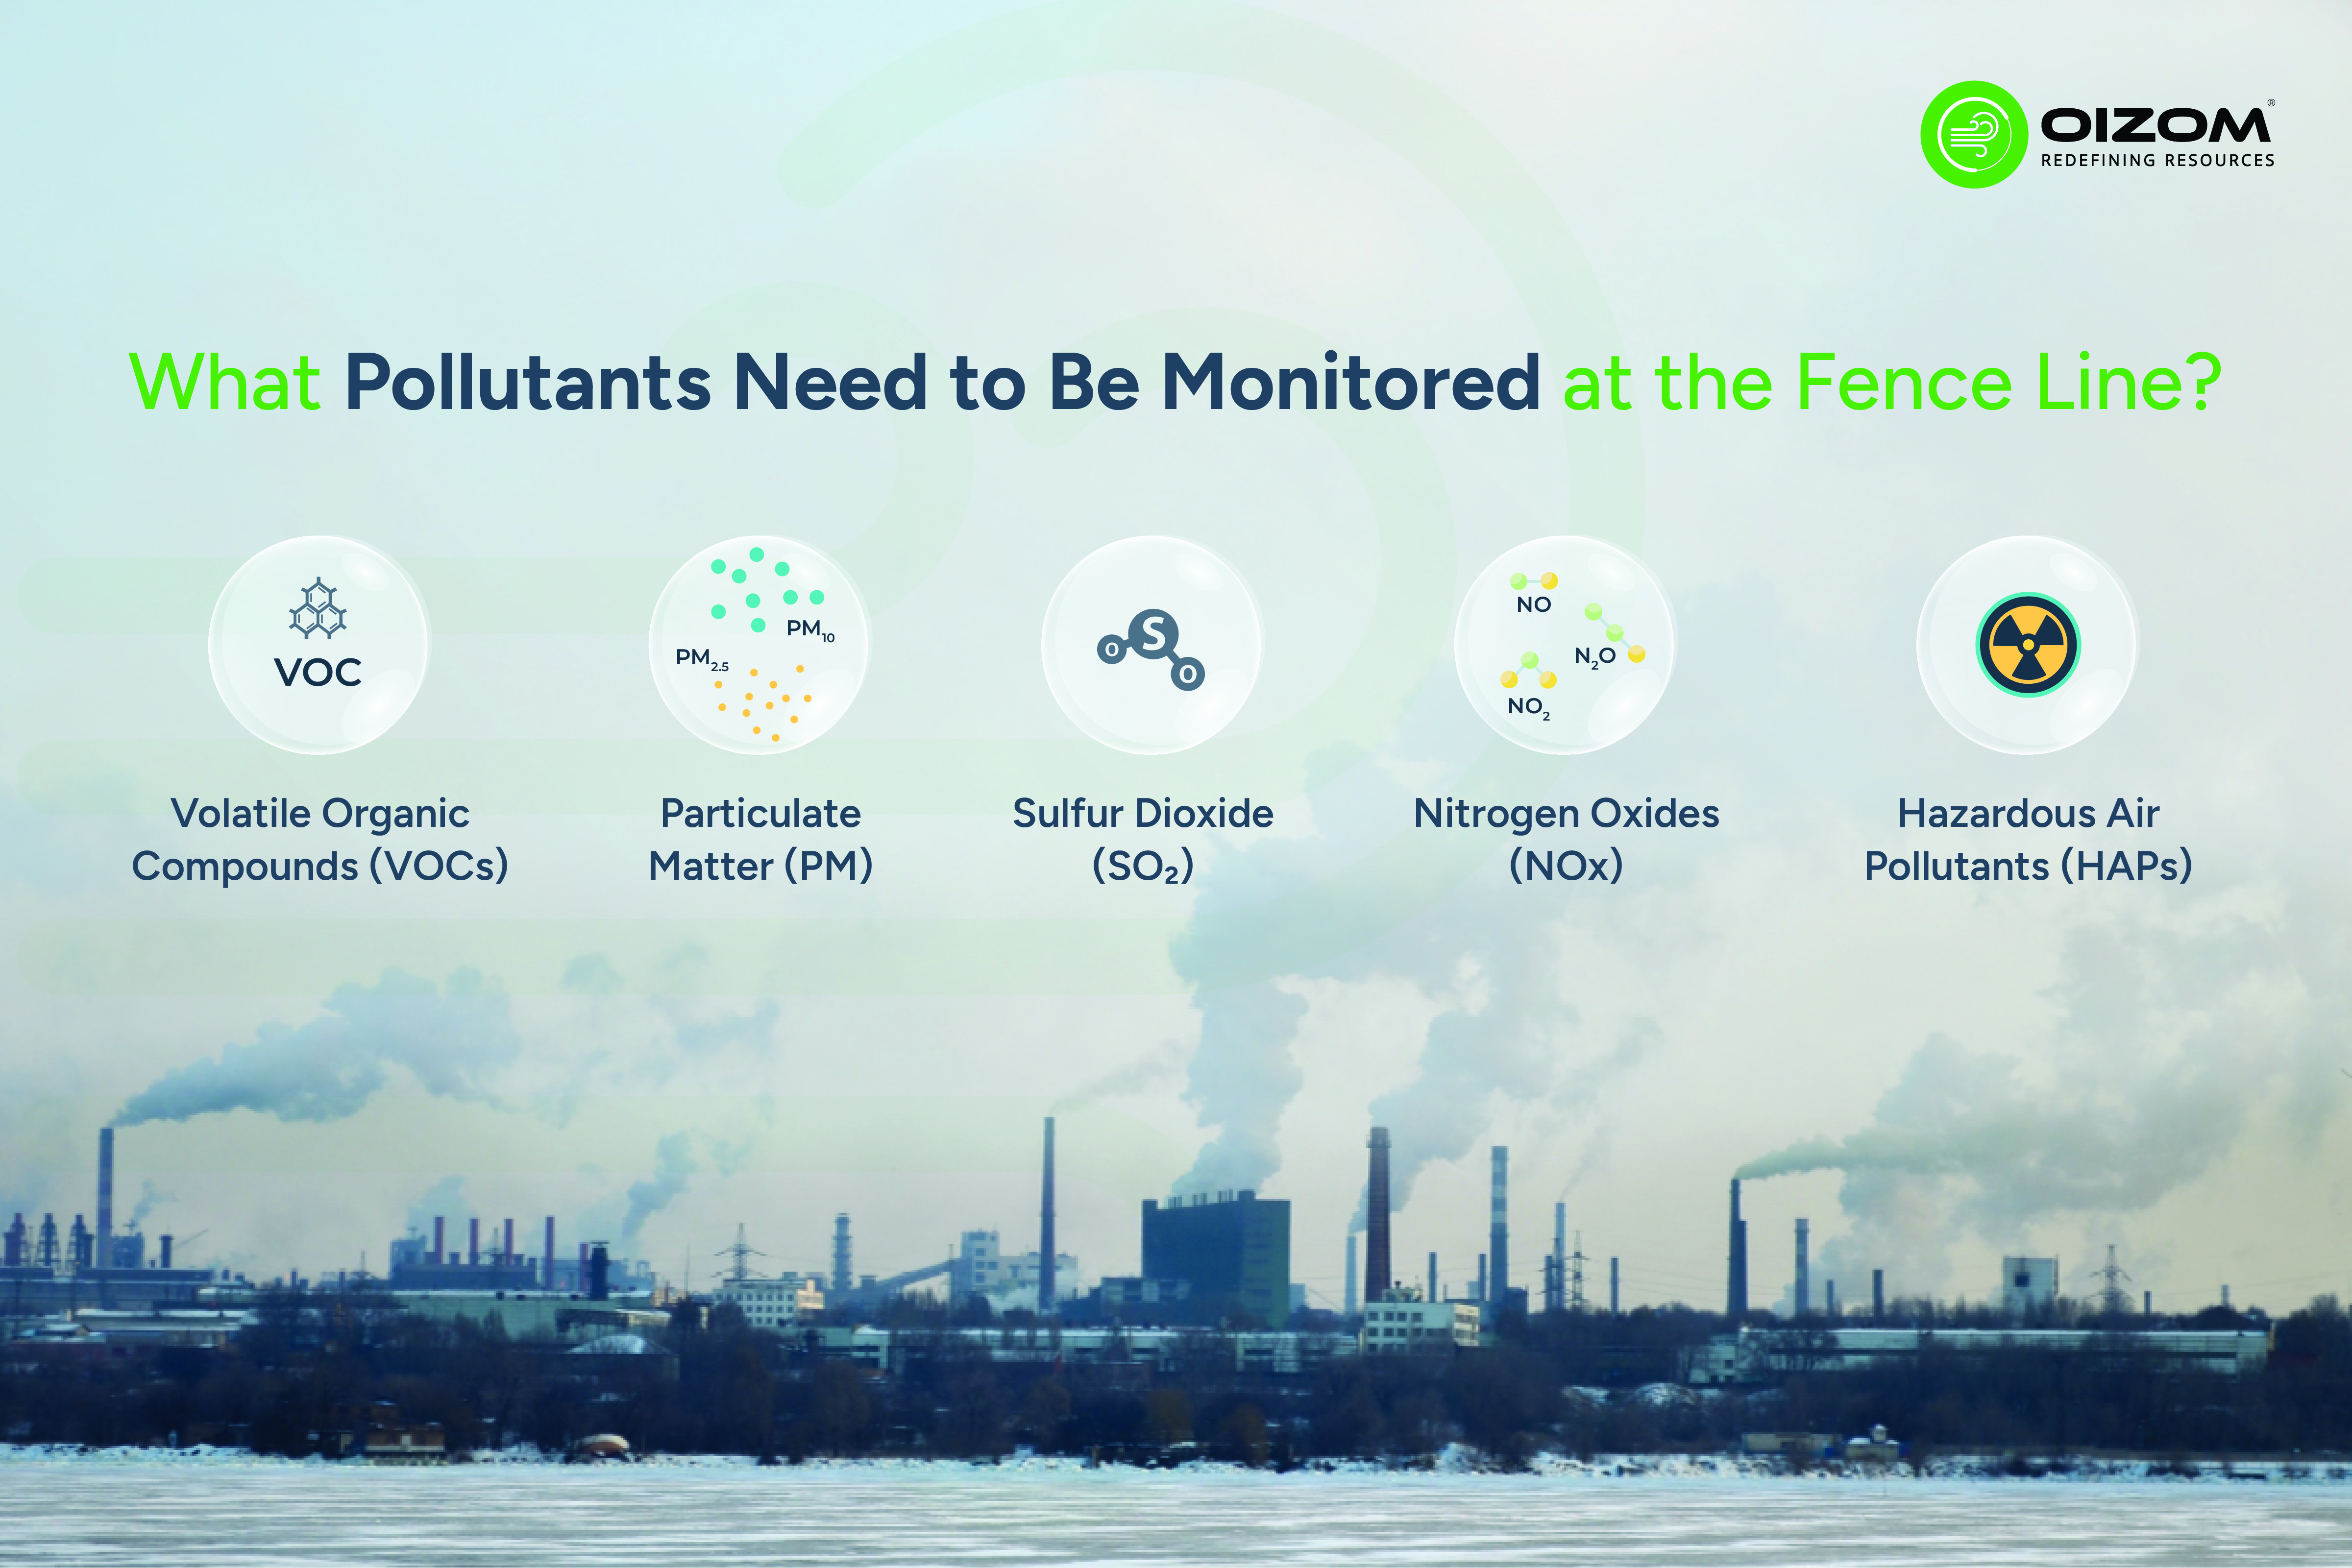
Typical fenceline pollutants include VOCs (benzene, toluene, xylene), particulate matter (PM2.5/PM10), sulfur dioxide, nitrogen oxides, and site-specific hazardous air pollutants, which vary by industry. In Indian petrochemical clusters, benzene has been a particular regulatory focus under recent CPCB guidance.
The FENCE Framework: Five Criteria for a Compliant Monitoring Program
Across 5,000+ monitoring deployments in 90+ cities, Oizom has consistently observed that fenceline compliance outcomes depend less on regulatory interpretation and more on five operational variables: the FENCE framework.
| Letter | Criterion | What it Requires in Practice |
| F | Fidelity of sensors to field conditions | Demand documented field performance data in your specific operating environment, not laboratory specifications. A sensor rated at ±2% at 25°C may drift to ±15% at 45°C and 95% humidity. Validate in conditions equivalent to yours. |
| E | Evidence-grade data continuity | Target 95%+ data uptime verified by automated anomaly detection that flags sensor drift, communication failures, and calibration deviations. Data gaps are compliance vulnerabilities. Data that does not exist cannot be used in your defense. |
| N | Network design matched to emission topology | Sensor placement is a technical decision, not a logistical one. Account for prevailing wind patterns, terrain, and proximity to multiple emission sources. A single upwind reference monitor plus downwind perimeter stations is the minimum viable configuration. |
| C | Connected to decisions, not just dashboards | Monitoring data that sits in a dashboard without connecting to operational workflows, escalation protocols, and regulatory reporting cycles does not reduce compliance risk; it documents unacknowledged exceedances. Oizom's Envizom platform converts raw sensor feeds into compliance-ready reports, automated regulatory alerts, and cross-departmental visibility. |
| E | Escalation protocols are defined before events | Pre-define and test three alert tiers: Tier 1 (operations team notification), Tier 2 (EHS leadership escalation), Tier 3 (regulatory or public disclosure). Programs with documented, pre-tested protocols consistently outperform improvised responses on regulatory outcomes. |
The FENCE framework covers what a compliant program is. From a procurement standpoint, the most common mistake is optimizing for purchase price over field performance. Organizations that select on cost alone typically spend significantly more over a three-year horizon through recalibration cycles, data gaps, and system replacements.
Sector-wise Meaning of Fenceline Monitoring
Fenceline monitoring can serve several purposes, depending on the unique emissions and operational risks of each industry.
Oil & Gas / Refineries
VOCs, such as benzene and other hydrocarbons, leak from tanks and valves during loading operations. Fenceline monitoring provides an early warning indicator for fugitive emissions and exceeding allowable limits set by the regulatory agency at the property boundary.
Chemical Manufacturing
Chemical Manufacturing tracks both Hazardous Air Pollutants (HAPs) and process emissions (emissions from a specific process or unit). The main objective of fence-line monitoring here is to manage exposure risk and ensure that emissions from multiple units comply with safe exposure limits.
Pharmaceuticals
Pharmaceuticals use fenceline monitoring to monitor solvent emissions at very low concentrations and by-products of chemical reactions. Fenceline monitoring is primarily used to ensure compliance with regulatory guidelines, prepare for audits, and prevent chemical drift off-site.
Mining & Metals
Mining and metals use fenceline monitoring to measure particulate matter dust and gases produced by combustion. Fenceline monitoring helps establish the extent of community exposure to dust and manage dust dispersion from mining and metal processing activities, including material extraction, handling, and milling operations.
Common Compliance Failure Patterns
Many organizations endure repeated challenges despite trying to do the right thing. Below are some of the most common issues organizations face after an initial period of success:
| Failure Pattern | Why It Costs More Later |
| Buying for purchase price over field performance | Sensors drift in high-humidity, high-dust environments, leading to data gaps and invalid compliance datasets |
| Data gaps during peak activity | Gaps cluster around high-emission periods, exactly when regulatory scrutiny is highest |
| Siloed monitoring systems | Data never connects to operational workflows or EHS systems, making response slow and audit trails weak |
| Inconsistent calibration | Inaccurate readings go undetected, turning a maintenance gap into a compliance liability |
| No anomaly interpretation protocol | Raw data without context creates noise that teams can't distinguish a sensor fault from a genuine emission event |
Why Most Fenceline Monitoring Programs Fail
Most failures have nothing to do with regulation complexity. They come down to three avoidable procurement mistakes:
- Buying for Compliance Paperwork, not Operational Resilience: A system that satisfies an audit but can't flag a real emission event in time is not a monitoring program; it's a liability with a dashboard.
- Selecting Lab-grade Specs Over Field-grade Reliability: A sensor rated at ±2% in controlled conditions can drift to ±15% in high-humidity, high-dust industrial environments. Specs on paper don't survive the field.
- Deploying Dashboards Without Response Ownership: Data that reaches a screen but not a decision-maker changes nothing. Monitoring without an escalation protocol is just documentation of problems you didn't act on.
How Fenceline Monitoring Systems Work
Continuous air quality monitoring typically uses a combination of fence-line sensors, data acquisition, and analytical methods to provide uninterrupted visibility. The best configuration, which may include fixed-location stations, open-path systems, or a mix of mobile units, is determined by the site layout, the types of emission sources in the area, and any applicable regulations.
Oizom devices, such as Polludrone and AQBot, are engineered for continuous fence-line monitoring at industrial facilities and integrate with a cloud-based application, Envizom, providing users with real-time dashboards and automated reporting.
Best Practices to Stay Compliant
Staying compliant comes down to a few non-negotiable habits:
1. Align with Regulations Early
Regulatory shifts, whether CPCB’s evolving CEMS requirements or the EPA’s benzene action thresholds, are rarely introduced without advance signals such as draft notifications, consultation periods, and industry advisories. Assign someone within the EHS team to track these developments quarterly so your facility can prepare ahead of enforcement deadlines.
2. Invest in Reliable Systems
Ask your vendor: What is your documented field performance? How often do you perform maintenance? Does your system self-monitor for anomalies?
3. Ensure Proper Placement
The minimum configuration that enables you to distinguish emissions from your facility from the background level must include at least one reference monitor upwind and at least two fixed perimeter locations.
What Good Looks Like: A Well-Run Fenceline Monitoring Program
A compliant fenceline monitoring system cannot be determined solely by the presence of sensors; it depends on how data flows through the system, how promptly it is addressed, and how consistently it is reported. It should be viewed more as an early warning system, similar to modern control rooms that monitor process parameters to prevent failures and prevent incidents from escalating, rather than just another compliance checklist.
The following describes what is typically found in a mature and functioning monitoring system.
1. Implementation Timeline (First 3–6 Months)
Month 0-1: Assessment & Design
- Identify regulatory requirements and site-specific pollutants
- Conduct site survey (wind patterns, emission sources, terrain)
- Define monitoring approach (fixed, open-path, or hybrid)
- Finalize sensor locations along the facility boundary
Month 2-3: Deployment & Integration
- Install calibrated sensors and communication systems
- Integrate with the central data platform and existing EHS systems
- Configure alert thresholds based on regulatory and internal limits
Month 3-4: Baseline Establishment
- Begin continuous monitoring
- Establish baseline emission levels under normal operations
- Validate data quality and eliminate early-stage inconsistencies
Month 4-6: Operationalization
- Train personnel on dashboards, alerts, and response protocols
- Implement standard operating procedures (SOPs) for incidents
- Align monitoring outputs with compliance reporting requirements
At the end of this phase, monitoring is no longer a project; it becomes part of daily operations.
2. Data Flow: From Sensor to Decision
In a well-run system, data does not sit idle; it moves quickly and purposefully:
Step 1: Continuous Data Capture
Sensors collect pollutant concentrations at defined intervals (e.g., every 1–5 minutes)
Step 2: Real-Time Transmission
Data is transmitted to a centralized platform via secure networks
Step 3: Automated Validation
System flags anomalies such as sensor drift, calibration issues, or data gaps
Step 4: Analytics & Contextualization
Data is processed with:
- Weather data (wind speed/direction)
- Historical trends
- Operational activity logs
Step 5: Alerts & Escalation
Threshold breaches trigger alerts:
- Tier 1: Internal notification (operations team)
- Tier 2: Escalation to EHS leadership
- Tier 3: Regulatory or public disclosure (if required)
Step 6: Response & Logging
- Teams investigate root cause (process upset, leak, sensor fault)
- Actions are logged for auditability
The key difference in high-performing programs: response time is measured in minutes or hours, not days or weeks.
3. Reporting Cadence & Compliance Rhythm
A strong program follows a predictable and auditable reporting structure:
Real-Time (Continuous)
- Live dashboards accessible to operations and EHS teams
- Alerts are generated instantly for threshold exceedances
Daily / Weekly
Internal Summaries:
- Emission trends
- Notable events or spikes
- System uptime and data completeness
Monthly
Compliance review reports:
- Rolling averages (e.g., benzene, VOCs)
- Calibration and maintenance logs
- Incident investigation summaries
Quarterly / Regulatory Reporting
- Submission of required metrics to regulators
- Documentation aligned with regional requirements (e.g., rolling averages, exceedance records)
Annual (ESG / Sustainability Reporting)
- Aggregated emissions data
- Transparency disclosures
- Demonstration of continuous improvement
Consistency matters as much as accuracy; regulators and stakeholders look for complete, gap-free datasets over time.
4. What Sets High-Performing Programs Apart
Across industrial sites, the most effective fenceline monitoring programs share a few common traits:
- High data uptime (>95%) with minimal gaps
- Clear ownership between operations, EHS, and management
- Defined response protocols, not ad hoc reactions
- Integration with operations, not siloed environmental data
- Proactive use of data to prevent incidents, not just report them
Most importantly, these organizations treat fenceline monitoring as an operational intelligence system, not just a compliance requirement.
Deployment Case Study: Tata Steel, India
At the TATA Steel manufacturing facility, ranked the world's No. 1 Steel Company in the Dow Jones Sustainability Index, Oizom installed Polludrone Smart for real-time monitoring of 12 parameters at their facility's fenceline. Since its operation commenced in November 2020, the system not only collects data passively, but also plays an active role in pollution management. Polludrone automatically activates Devic Earth’s Pure Skies system when pollution crosses preset thresholds, reducing response time, supporting CPCB compliance, and improving air-quality transparency for nearby communities.
Numerous industrial projects employing continuous monitoring of emissions have reduced reportable emissions events and achieved persistent reductions in air pollution levels; thus demonstrating the value of proactive management through early detection and timely intervention. A total of 5,000+ monitors have been installed in over 90+ cities and are designed to maximize the availability of reliable data for auditors, ensure ongoing compliance with industrial regulations, and minimize the potential for downtime.
How Real-Time Monitoring Improves Compliance Outcomes
As Sohil Patel, CTO at Oizom, puts it: "The shift from periodic to continuous monitoring isn't just a technical upgrade; it changes the entire relationship a facility has with its own emissions data. You stop being reactive and start being in control.”
Real-time monitoring often reveals far more than abnormal readings. Emission spikes are early indicators of process drift, equipment leaks, or sub-optimal operating conditions. Facilities that analyze fenceline data alongside operational parameters often uncover direct links between emissions performance, process stability, and resource efficiency, turning monitoring into a source of operational intelligence rather than just environmental reporting.
Conclusion
Compliance with fenceline monitoring is now an expectation rather than a niche requirement and increasingly, an operational priority.
“From an operations standpoint, the real value of fenceline monitoring is predictability. With continuous visibility into emissions, teams can plan interventions, avoid disruptions, and reduce reactive costs.”
- Vrushank Vyas, COO, Oizom
Compliance with CPCB inspections, consent renewals, or refinery benzene action levels now depends on facilities' ability to demonstrate continuous data integrity, continuous calibration traceability, and the ability to respond quickly to events that cause exceedances, rather than just coming in and filing emission reports on time. To achieve compliance by collecting accurate data about the facility every day, facilities will need to establish systems that enable this consistently. Therefore, compliance will result from properly operating your facility, rather than from scrambling to meet requirements during an inspection or audit. Remember, emissions don't wait for an audit; therefore, neither should your monitoring.
.webp&w=3840&q=75)
.webp&w=3840&q=75)


.be0dea41.svg)

.webp&w=1920&q=75)
.webp&w=1920&q=75)