Envizom - Advanced Air Monitoring Software for Professionals
Envizom offers remote and real time air quality data access to professionals for their Air Quality networks.
“We have installed a large network of OIZOM smart air monitoring sensors across Australia. OIZOM Terminal provides easy access to data, trends, reports, and alerts.”
Ben Payami, Ektimo Pty Ltd, Australia
Envizom - Advanced Air Monitoring Software for Professionals
Air Quality Monitoring Software
Envizom
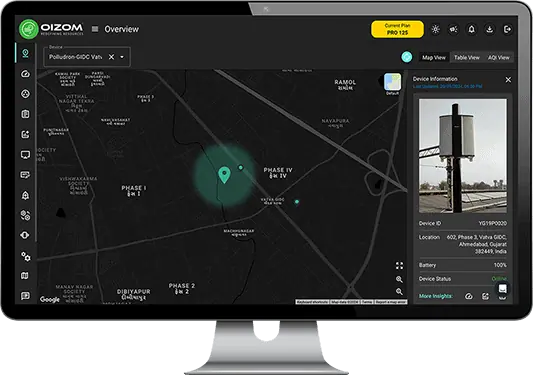
Discover Envizom, your intelligent, web-based cloud platform for real-time air quality monitoring and analytics powered by Oizom’s advanced environmental interpretation engine. Envizom can collect and refine data from environmental monitoring stations, presenting it through an interactive dashboard with diverse chart options and geo-mapped device locations. The data is securely encrypted, ensuring reliable and safe access to critical air quality information.
With Envizom, experience enhanced convenience through remote access, automated reports, smart alerts, and seamless process automation. These features enable smooth integration with external systems for effective mitigation. Envizom ensures that you’re always informed and empowered to keep the air around you safe and clean. Embrace the power of Envizom—a clear, reliable solution for accurate air quality insights at your fingertips.
Key features
Real time data
Envizom platform offers real time data visualization of all environmental parameters.
Smart alerts
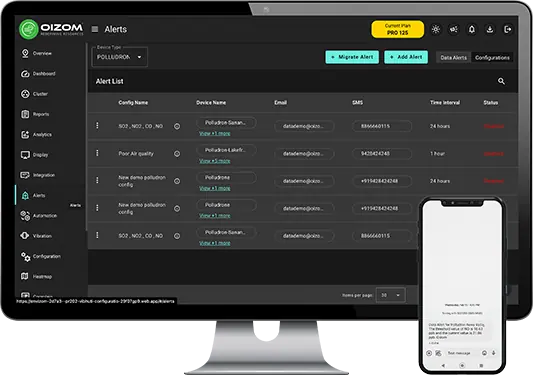
Set alerts based on predefined threshold values and send notifications to the respective users through SMS, Email, and push notifications.
User friendly interface
Envizom platform is user-friendly, and navigation across modules is hassle-free and interactive.
Endorse your brand
Customise the Envizom platform by adding your brand logo to endorse your brand.
Process automation
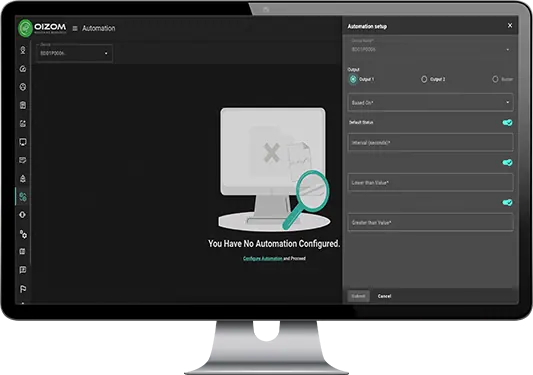
Enable process automation using our relay-based module and set thresholds to automate the integrated systems.
Integrate external sensors
Integrate and monitor data of third-party accessories such as Vibration, Noise Class 1, Lightning, Evaporation, temperature, and soil moisture & soil temperature sensors.
Easy to Set Up
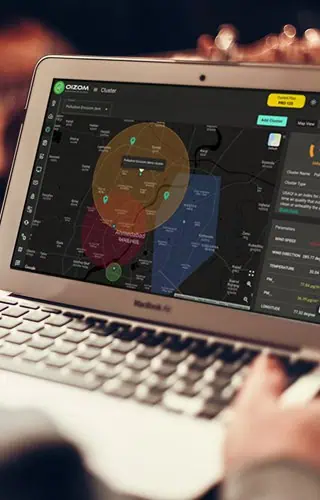
A simple two-click setup application for users to access data remotely on any web browser.
Advanced Analytics
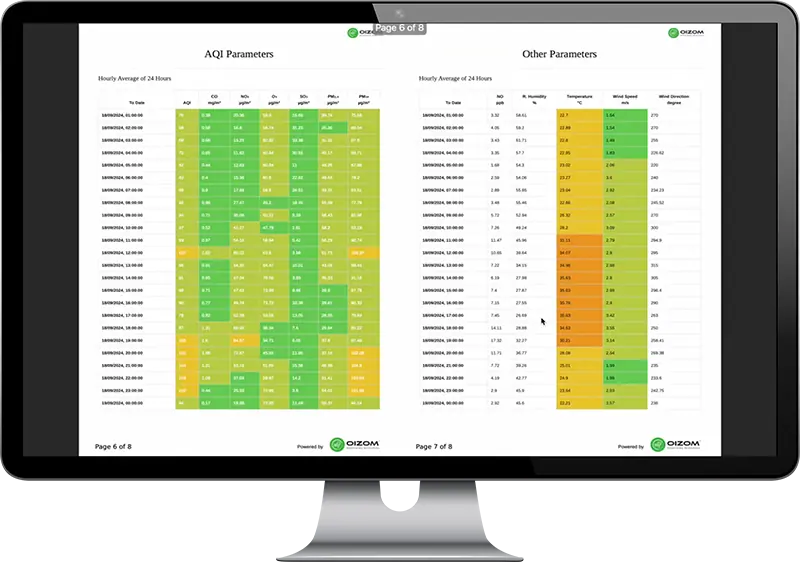
Get automated reports every day / week / month and quick reports to understand and analyse the air quality data with different formats.
Data accessibility
Access real-time data on the go from any smart device like a laptop, tablet, or mobile phone.
Easy to Integrate
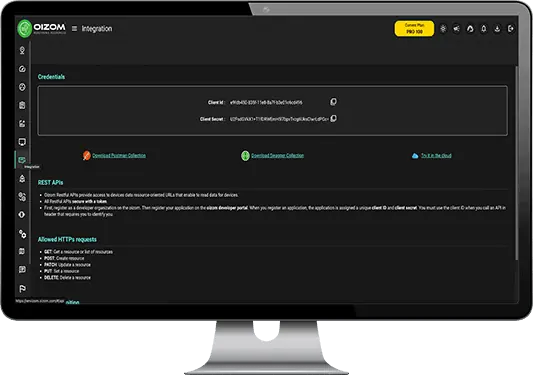
Through our REST APIs, data from all the Oizom® equipment can be integrated into any third-party software platform.
Set Clusters
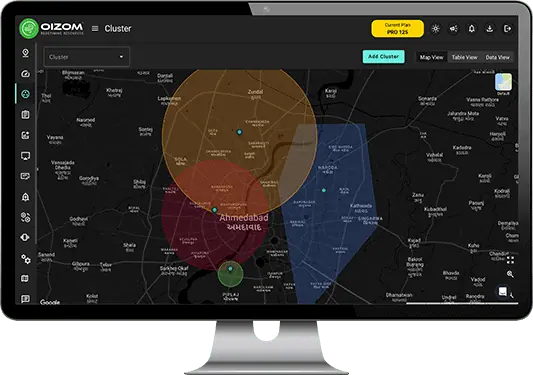
Users can create their own clusters by combining data points based on specific areas, like residential, industrial, and city.
Reports
Get automated reports every day/week/month and quick reports to understand and analyse the air quality data with different formats.
Privacy First Platform

Data Privacy
Envizom receives the data from the Oizom equipment through a highly secure network. The data shared between the client uses an encryption server through HTTPS Secure Socket layers. In addition, the Envizom Air Quality Monitoring Software uses AES encryption for connection that adds to data safety.

Data Ownership
Users can access the data from the equipment using a unique user-based authentication. The Envizom creates a secured and encrypted password combination for the user login. Oizom ensures 100% privacy of the data and doesn’t share without relevant permissions.

Data Transparency
The data collected from Oizom equipment runs through the Environment Data Interpretation Engine to process various algorithms. It eliminates the interference caused by the environmental impact on the sensors. The device performs all the corrections and sends the data to the database for visualization and analytics.

Most Advanced Air Monitoring Software
Contact us to learn more about our air quality monitoring software and solutions.
Most Advanced Air Monitoring Software
Contact us to learn more about our air quality monitoring systems and solutions.
Envizom Capabilities
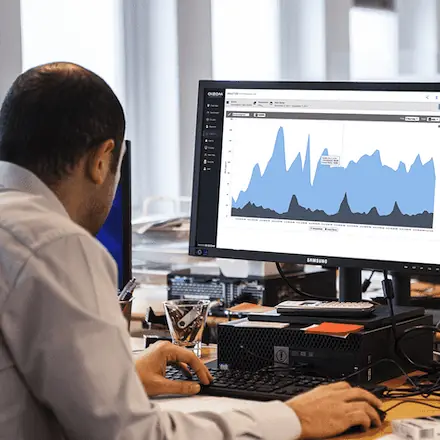
With our web-based air quality monitoring software – Envizom, the professionals can access and analyze the air quality data remotely from anywhere. After monitoring the environmental data, its analysis and visualization become essential to comprehend the entire scenario.
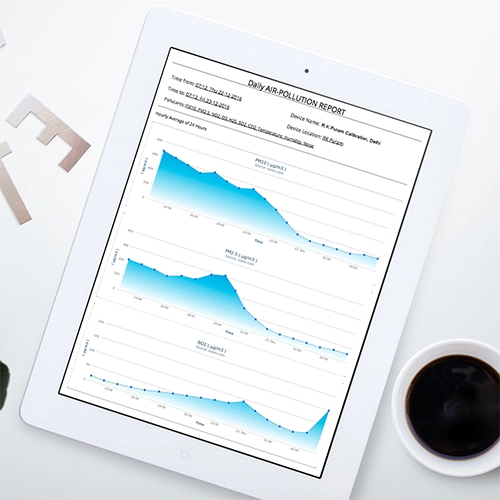
Environmental data analytics needs to be made accessible in a user-friendly way. Envizom generates data insights in various formats like printable reports, downloadable CSVs, and voice-activated data access. Data transfer integration to a 3rd party application or external IT infrastructure is possible through Oizom APIs.
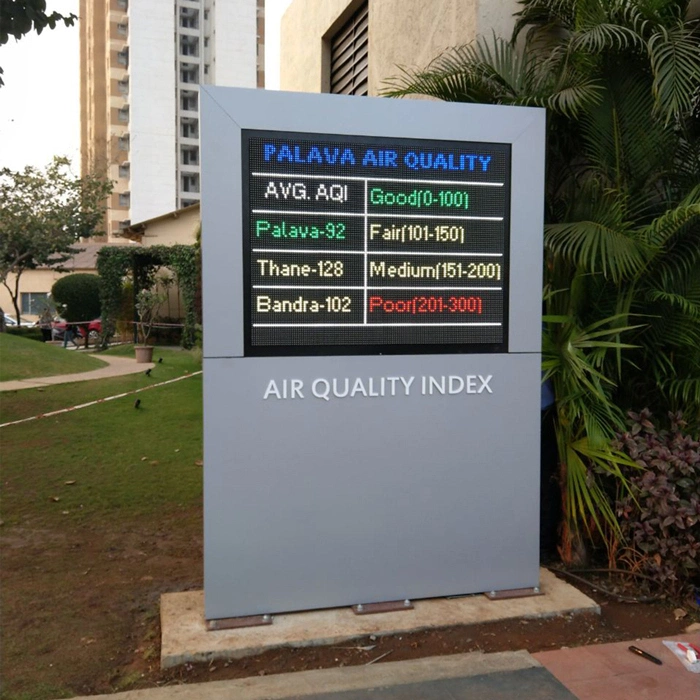
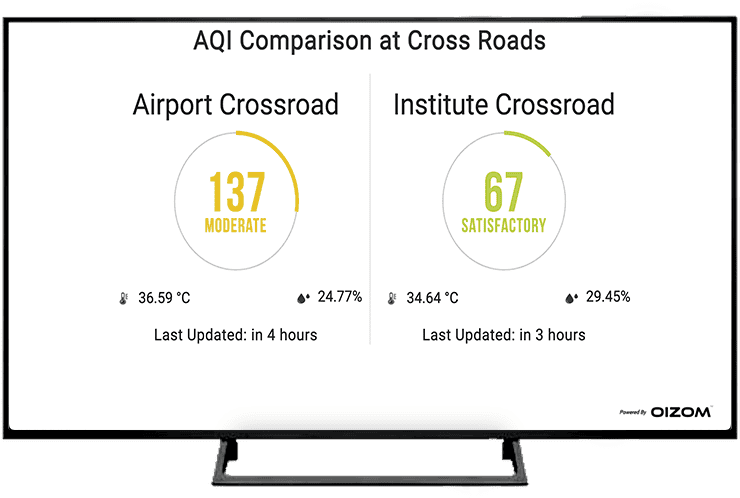
Dissemination of environmental data is critical for public awareness. This can trigger environmental actions among the mass audience. Using various data publishing mediums, environmental health advisory can be served at once. The data publishing is possible through outdoor LED Display Boards, TV Screens, and integrable Web Widgets.
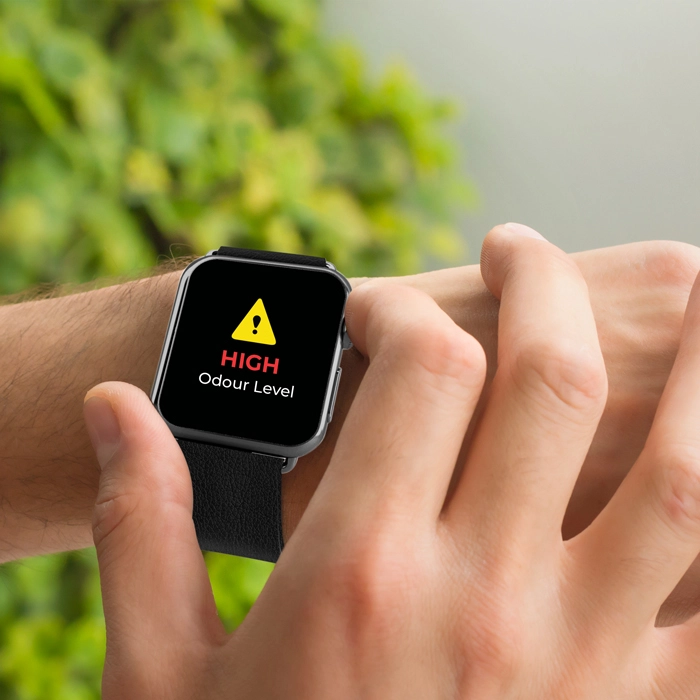
Oizom® is committed to making environmental data more understandable by offering immediate alerts for timely decisions. Data-driven suggestive actions are provided to the authorities to mitigate any significant future risk, such as an industrial accident, natural hazard, or man-made hazard.
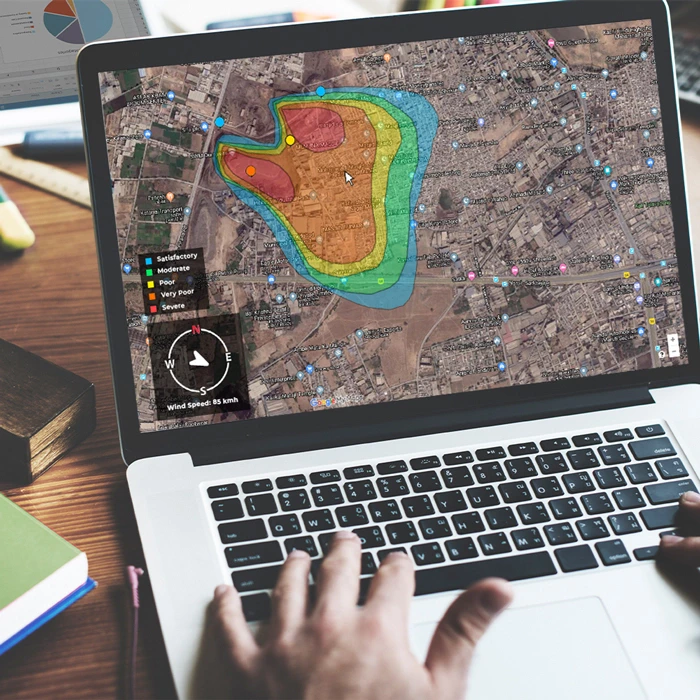
Air Pollution Modelling Software - Oizom’s Environmental monitoring platform provides environmental data prediction and forecasting through Machine Learning (ML) and Artificial intelligence (AI). The purpose of environmental data prediction is to analyze the past and current environmental trends of a region to forecast its future air quality and impacts. The data obtained from a few locations can be used to predict the environmental conditions of the surrounding area using methods like interpolation, extrapolation, and environmental modeling.
Do you have a specific requirement?
Schedule a call with our expert team and get a customised solution
for your air quality monitoring requirement
Why Customers Choose Envizom
2 level user management
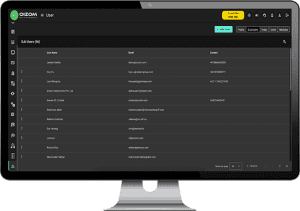
Envizom Air quality monitoring platform has a two-level hierarchy with Admin users and sub-users. Admin users have all the rights to add, edit and delete sub-users as per the requirement. Admin users also control the number of visible devices and modules under each sub-user.

Tech support
Oizom provides remote technical support as well as physical support. We also have a ticketing system to maintain all support-related issues. We retain an SLA of 24 hours for better understanding and clarity of the issues. The technical team helps the onsite team to carry out initial troubleshooting of the issue.
Supports third party devices
Envizom can integrate third-party devices using APIs. So, users can access and analyze environmental data from multiple devices made on a single platform.
Calibration Module
Envizom provides a device calibration module. This module enables our partners and users to calibrate Oizom equipment in the lab and site. Users can also view and access historical calibration data from the platform.
Remote diagnostics
Oizom architecture is built in a way to carry out remote diagnostics of the device. The oizom tech team carries out regular remote diagnostics of the devices. Based on various data points, the health of the device is also regulated.
Envizom Modules
- Geo-tagging of environmental equipment on the map.
- Access real-time environmental data in a tabular format.
- Visualize environmental data in 1, 8, and 24-hour data formats. Visualize and download environmental data in informative chart formats.
- Download the environmental data in CSV format for further analysis. Predict environmental data for the next 24 hours using advanced forecasting models.
- Group geography-specific equipment as per requirement.
- Assign different data indexes to other sensor groups, i.e., Industrial, Urban, Vehicular.
- Users can add multiple clusters as per the requirement.
- This cluster data is available in 1, 8, and 24-hour data averages.
- Download data in CSV format.
- One-click download of auto-generated reports in PDF format.
- Schedule daily, weekly, and monthly automated reports to registered email IDs.
- Generate quick reports as per user requirements.
- Print-ready reports in tabular and chart format.
- Users can set alerts based on predefined thresholds.
- Receive instant alerts via email, SMS, and notifications.
- Access quick notifications on equipment health and battery status.
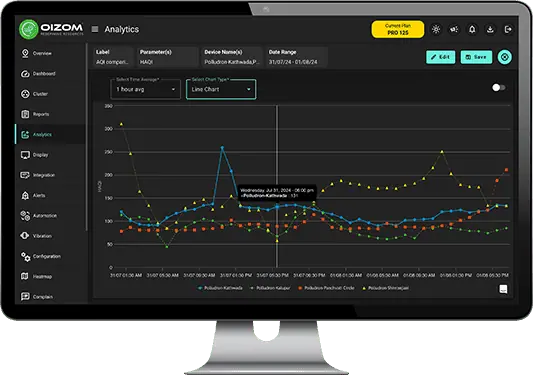
- Comprehensive analysis of environmental data.
- Users can compare and analyze various parameters, equipment, and chronology.
- Analyze the data in line, area, column, and area-spline charts.
- Download, share, and save the diagram for future reference.
- Create custom display and showcase on LED and LCD boards like TVs and monitors.
- Ready to use display templates like Equipment data Comparison, AQI Comparison, and Parameter table.
- Generate desired iframe-based widgets as per requirements.
- Secured REST APIs for integration into 3rd party platforms.
- Integrate HTTP APIs from 3rd party devices into Envisuite Platform.
- Upload 3rd party device data through CSV files into Envisuite Platform.
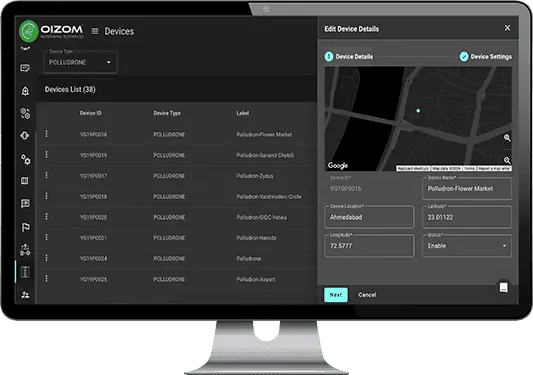
- Edit equipment-related information like Device Name, latitude, longitude, location.
- Enable or disable equipment data as per requirement.
- Manage data interval for Oizom equipment.
- Admin can create multiple users and provide them access to specific equipment and modules.
- Users can select their desired data unit format, e.g., ppm, ppb, µg/m³
- Select AQI types based on your geography.
- Set parameter configurations to enable automation.
- Configure relay from anywhere
- Integration of the relay with 3rd party devices for process automation
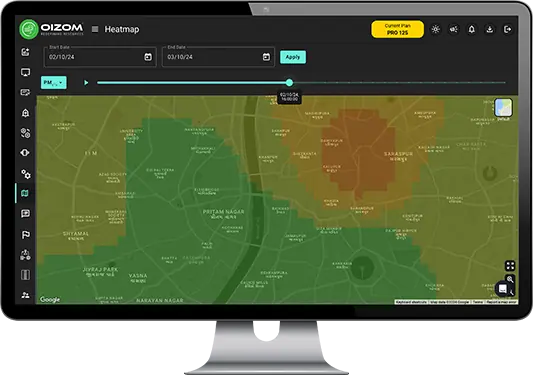
- Generate high-accuracy environmental heatmaps using advanced Inverse Distance Weighting (IDW) algorithms.
- Combines meteorological factors like wind speed, wind direction, temperature, and humidity to create dynamic and precise heat maps.
- Get color-coded maps to visualize pollution and emission trends at various sources.
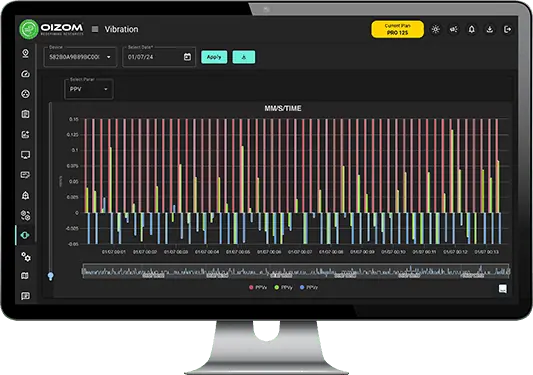
- Integrate a vibration sensor with Envizom to track gravitational force.
- Measures multiple parameters, including gravitational force over time across different axes, peak particle velocity, peak vibration accelerations, and frequency.
- Get a comprehensive view of environmental dynamics for improved insights and decision-making.
Solution Architecture
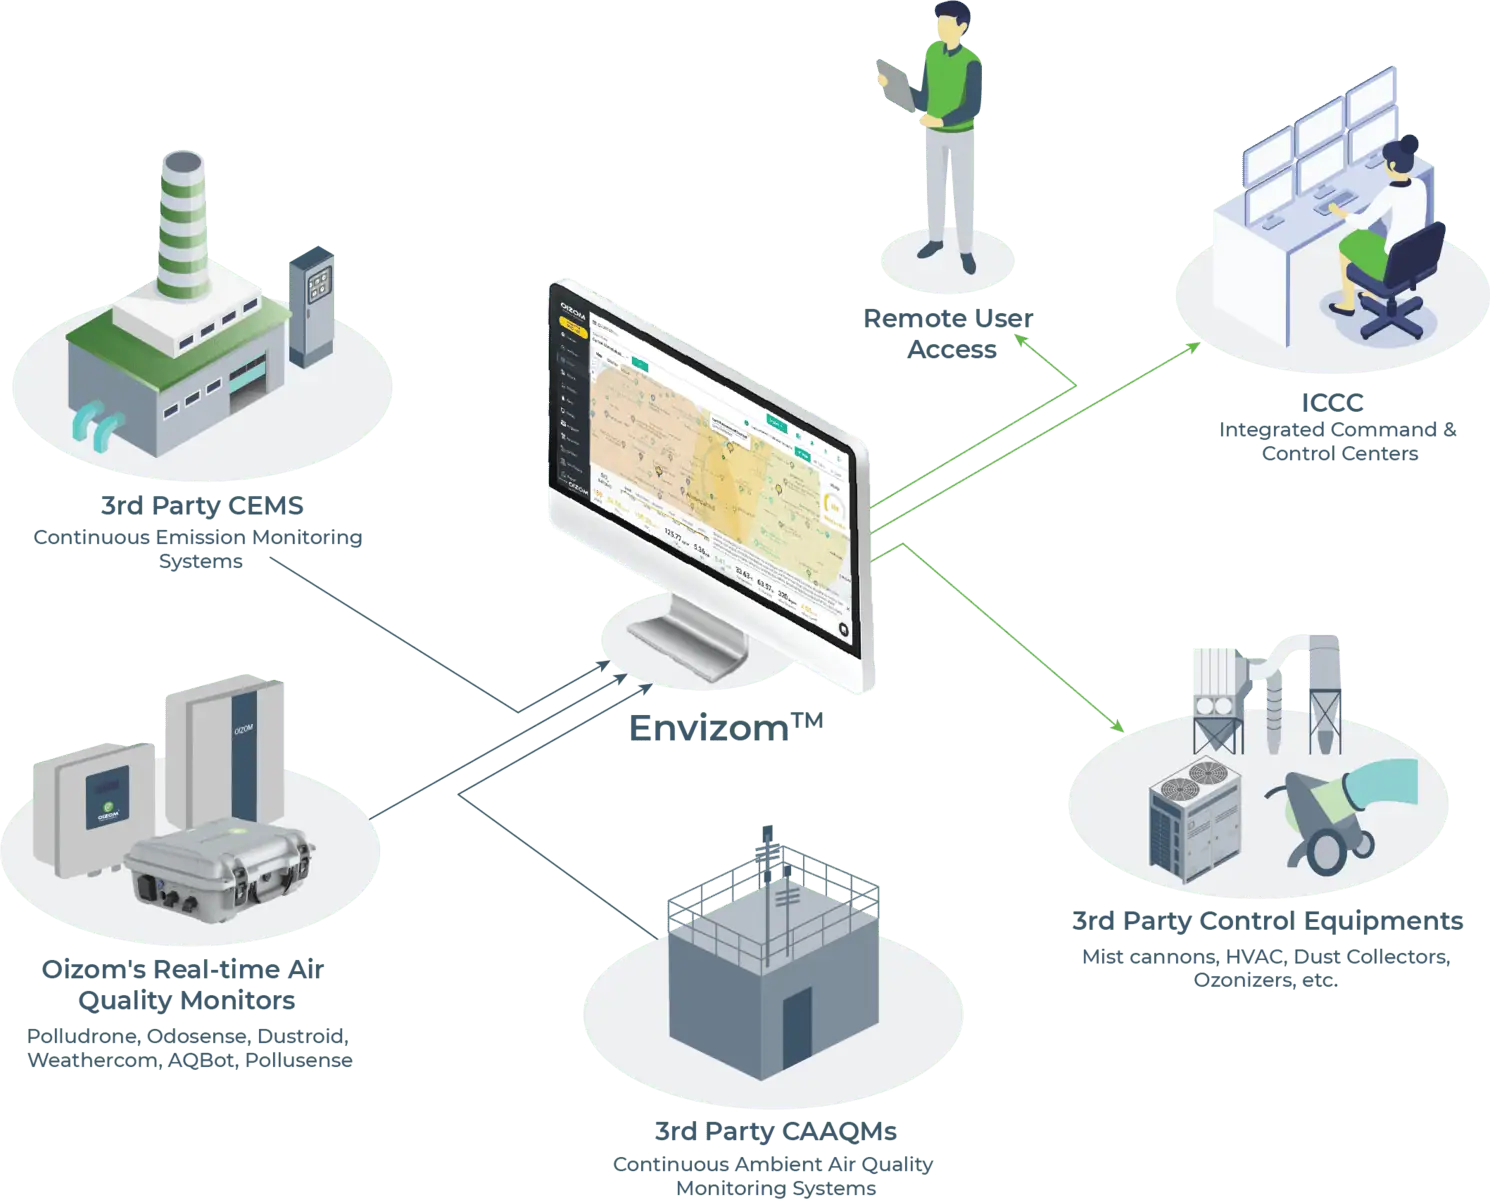
Device Compatible With Data Platform
Case Studies
Envizom Platform FAQs
Overview & Dashboard views are complimentary with the devices. Moreover, users can also opt for additional paid modules like Advanced Analytics, Automated reports, Smart Alerts, Complain Modules, High-resolution heatmaps and web widgets. The data can also be integrated into other platforms using our APIs.
Yes. The data can be displayed directly to the outdoor LED boards using i-Frame based widgets OR APIs
Oizom offers REST APIs ( Sandbox) which can be accessed from your Web terminal or by getting in touch with your Project Manager.
Yes, the admin user can limit access to modules for its sub users. Also, the admin user can add or remove sub users.
Envizom provides user module which lets the user reset the password.
Yes, You can access the data through HTTP & MQTT based APIs.
Yes. You can choose the type of iframe that you require and add that into your existing website. Moreover, you can also use the APIs to create your custom visualization.
Yes, please get in touch with your project manager they shall assist you with the same.
Yes. You can install Oizom app on your mobile phone to access data from anywhere.
We have partnered with several Global Telco companies. The telco provider is subjective to the geographic location of the installation.
Envizom sends push notifications to alert you of critical situations.
Yes. The data unit configuration can be done by the Super Admin on the Envizom. If you are facing issues please get in touch with our team here.

