Visualization & Analytics
ENVIRONMENTAL DATA SOFTWARE FOR VISUALIZATION & ANALYTICS
With our web-based air quality monitoring software – Envizom, the professionals can access and analyze the air quality data remotely from anywhere. After monitoring the environmental data, its analysis and visualization become essential to comprehend the entire scenario. Data from air quality software can be presented in various forms depending upon the customer’s requirements such as creating public awareness, statistical analysis, performing studies, etc. The analytics feature of the AQI software helps to identify the root cause of the problem and suggest possible actions. The primary purpose is to break down the complex environmental data to make it comprehensible for the consumer.
Data Overview
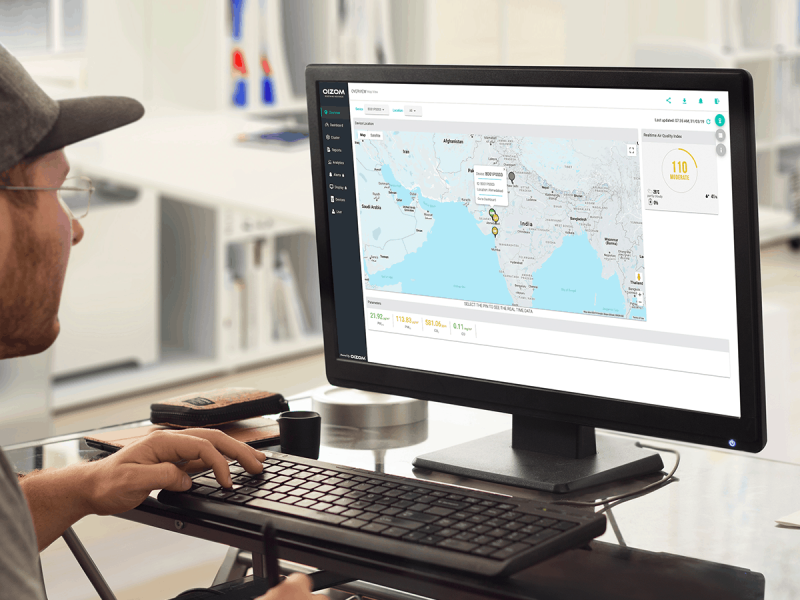
Our Air quality monitoring software – Envizom, provides a macro picture of the environmental condition of all the selected locations. It represents real-time environmental data in a geo-mapped visualization along with calculated Air Quality Index. The air quality software shows the concentration of each environmental parameter being monitored along with the calculated AQI. You can observe the real-time pollution data along with weather parameters like wind, temperature, and humidity. The colour-coded index is deemed necessary to understand and interpret the concentration of various pollutants.
Data Overview
Micro Analysis Dashboard
Micro Analysis Dashboard
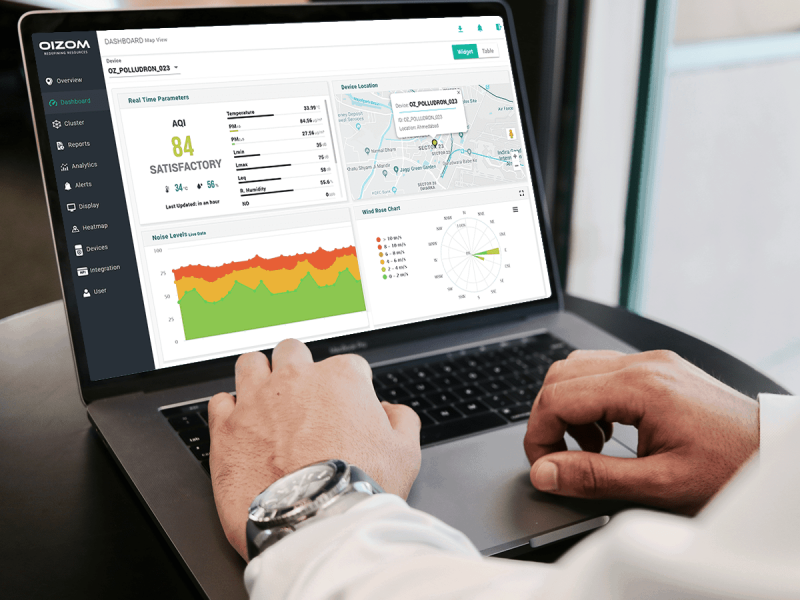
Air Quality Software – Envizom’s dashboard module provides a detailed representation of the environmental data from each air quality monitoring equipment. The terminal dashboard allows users to visualize the environmental data with interactive charts, graphs and data tables. The dashboard exhibits Pollution Rose and Wind Rose Chart to represent the pollution dispersion along with the wind. It also displays the ambient noise pollution via a Noise Chart. The average Air Quality Index (AQI) is also provided for each parameter concentration as hourly average and real-time data. A detailed box plot enables air quality trend analysis.
Historical Data Analytics
The Analytics module of Envizom- air quality monitoring software, provides three ways for analysis – location, parametric, and time-span comparisons. The web-based aqi software provides Location Comparison, which allows comparing the data of two or more equipment installed at different locations for a particular parameter for a fixed period. Parametric Comparison allows the comparison of multiple parameters of one location for a selected time. Time-span Comparison analyzes the parametric data of a location for different time slots, such as morning vs evening-peak hours.
Historical Data Analytics

Mobile App
Mobile App
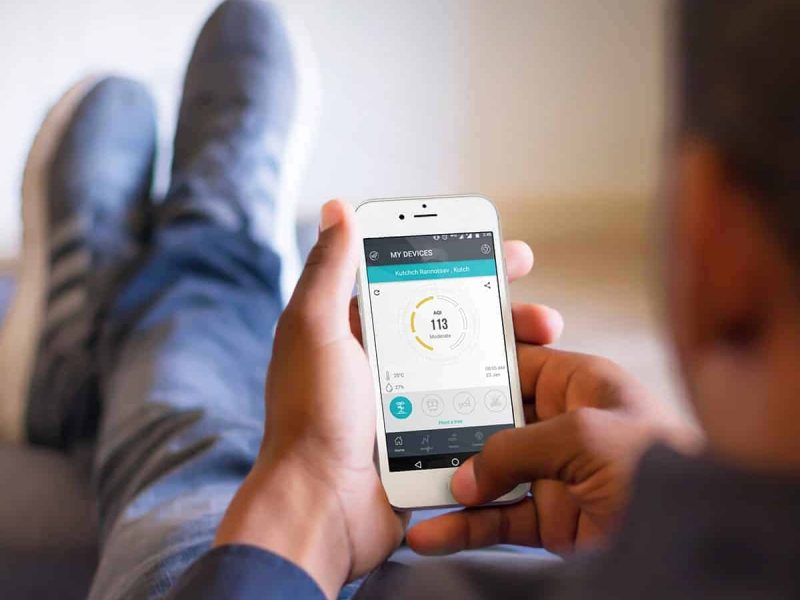
Oizom mobile app allows users to visualize the air quality of their city and compare it with AQI of hundreds of cities around the world on the go. The user-friendly app also generates alerts every time there is a pollution threshold breach. The aim is to make environmental data accessible to each individual for increased public awareness through the mobile app. This can simulate the precautionary actions by the citizens for their day-to-day activities to achieve better health.

