Continuous Odour and Dust Monitoring at a Poultry Processing Plant, Hungary

Hungary

4 June – 3 July 2025

Industrial Odour

Poultry Processing Group

Odosense Smart, Dustroid Pro, Pollusense

Poultry Processing Plant Odour Monitoring
Introduction
A month of continuous measurement turned a diffuse odour problem into two specific, fixable sources. That was the outcome of a pilot run at a poultry processing plant operated by a Hungarian-owned group of companies.
The group has built its reputation on quality poultry and consumer trust. It sees responsibility to the surrounding community as part of that commitment. Odour is where a processing plant's footprint is felt most directly by its neighbours, so management wanted to understand it with data rather than complaints.
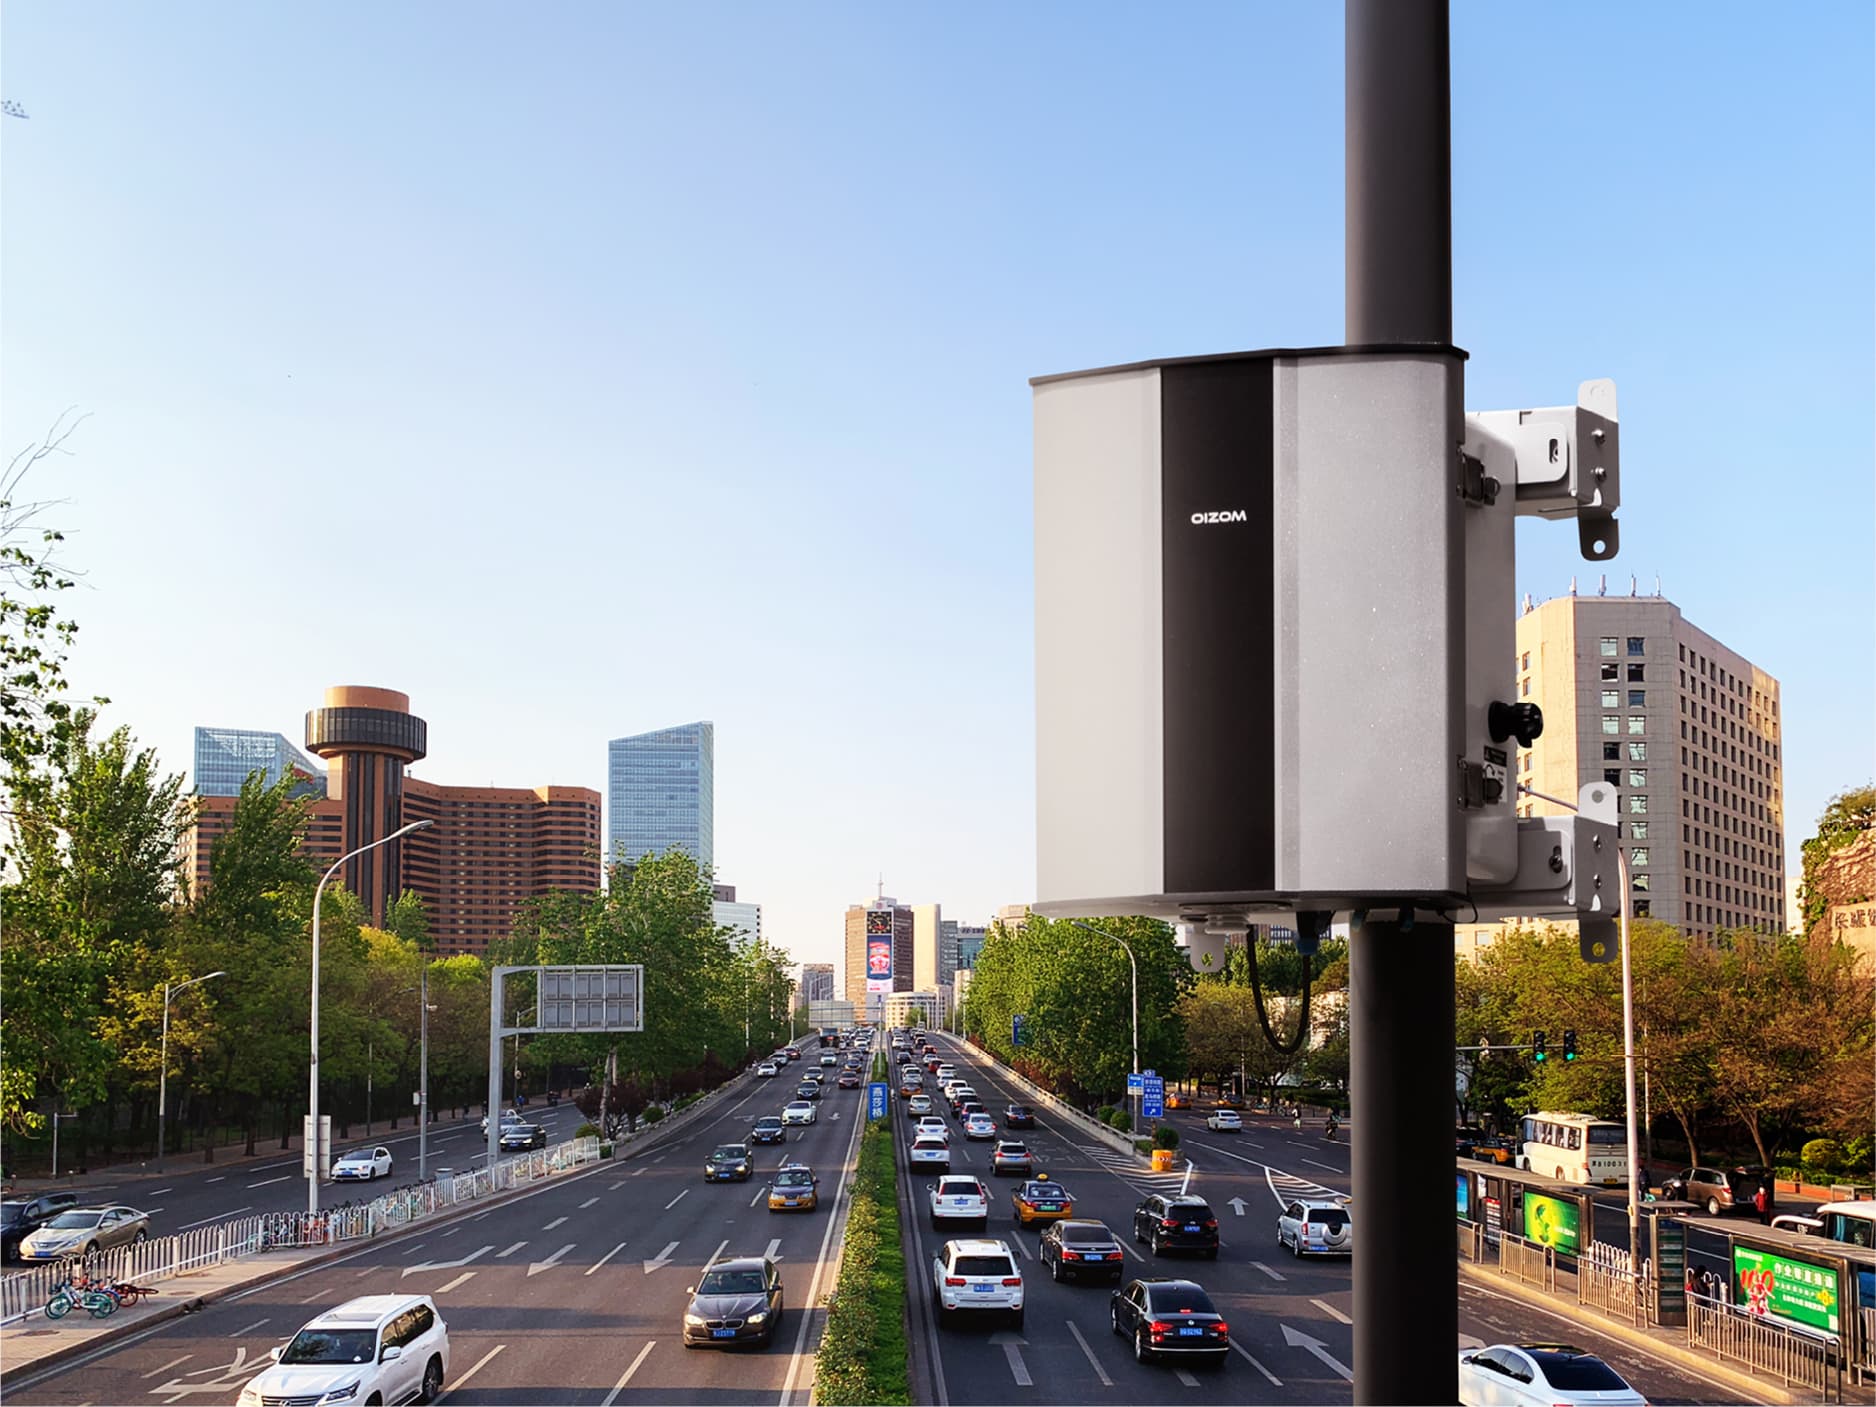
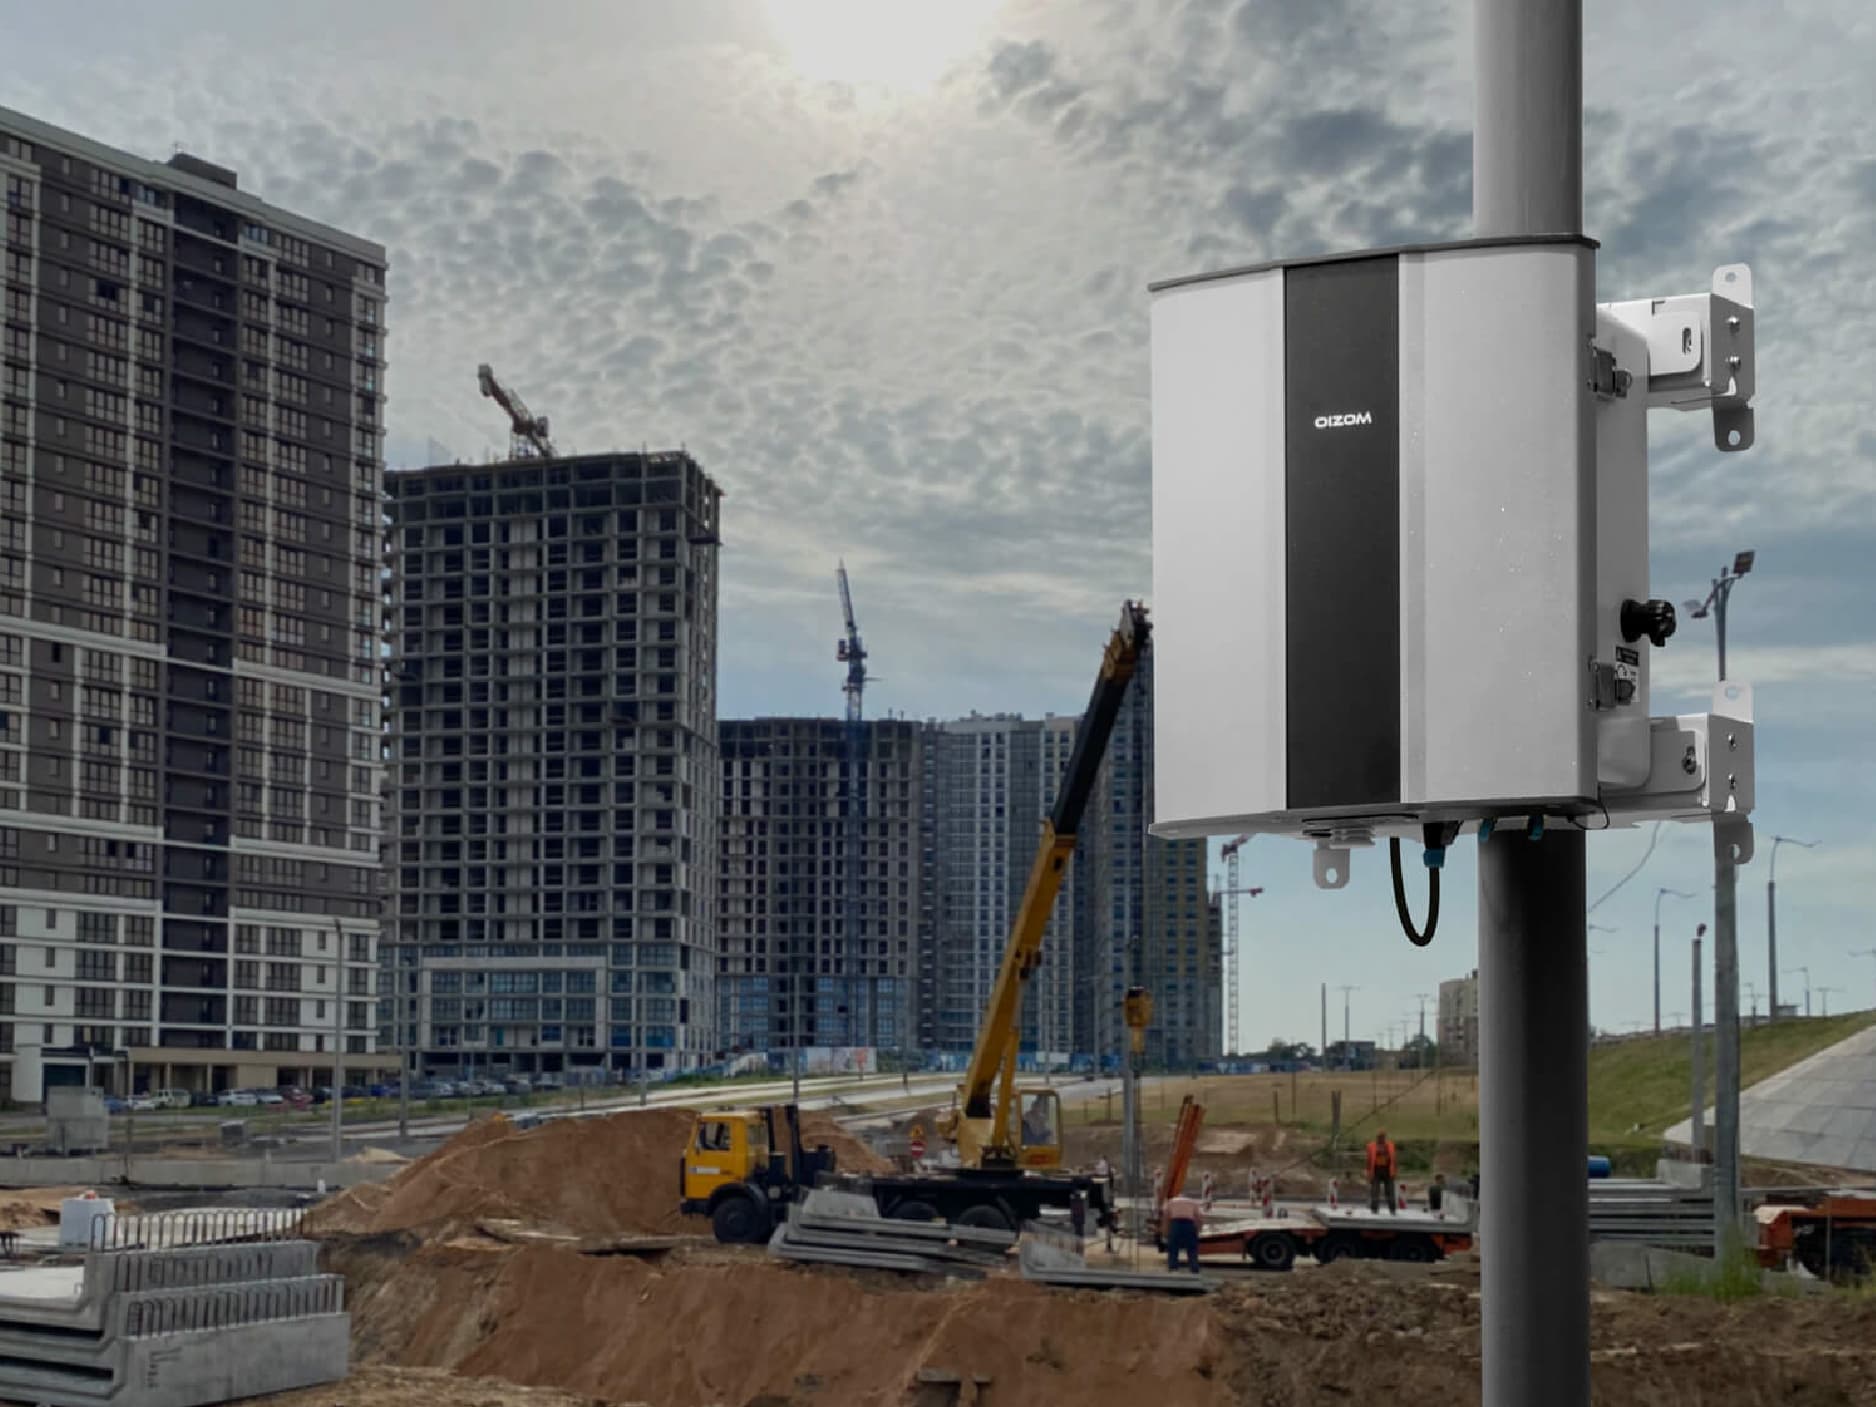
Working with Oizom's distribution partner in Hungary, the plant deployed an Odosense Smart odour monitor and a Dustroid Pro particulate monitor for a month. The study closed with a walk-through audit using the portable Pollusense. The aim was to map where odours arise, when they peak, and which way they travel.
03 | 29 | 14 | 07 |
The Challenge
Odour is one of the hardest environmental impacts to manage because it is intermittent, invisible and subjective. At a poultry processing plant, it comes from many places at once: carcass handling, by-product storage, wastewater treatment and exhaust air.
The compounds involved are potent. Methyl mercaptan (CH₃SH), a sulphur compound released as organic matter breaks down, becomes unpleasant at around 0.002 ppm. That is roughly a thousand times below the level at which it becomes an irritant. A few parts per billion can be enough to draw a complaint.
The traditional reference method, dynamic olfactometry, relies on trained human panels judging collected samples. It is accurate but slow and periodic, so it cannot show how odour behaves hour by hour. Before this study, the plant had no continuous record of when odours peaked, how strong they were, or where they came from.
Management needed a monitoring approach that could:
- Measure the key odour-causing gases continuously, and express them in a form that relates to what people actually smell.
- Capture wind speed and direction alongside each reading, so odour events could be traced back to a source.
- Distinguish conditions at the site boundary from conditions inside the plant.
- Track dust alongside odour, since particles from handling and processing can carry odorous compounds.
- Pinpoint individual sources, not just confirm that an odour problem exists.
Why Oizom
Oizom offered a single toolkit that covered all three layers the plant needed: continuous odour data, continuous dust data, and on-the-spot source checks.
- Odour expressed in Odour Units: Odosense converts gas concentrations into Odour Units (OU). One OU is the concentration at which half of a population can detect a smell, based on published detection thresholds. This makes a reading of "159 OU" meaningful to a plant manager in a way that parts per billion is not.
- The Right Compounds for Poultry Processing: Odosense measures CH₃SH, H₂S, NH₃, SO₂ and TVOC, the gases most associated with protein breakdown and animal by-products.
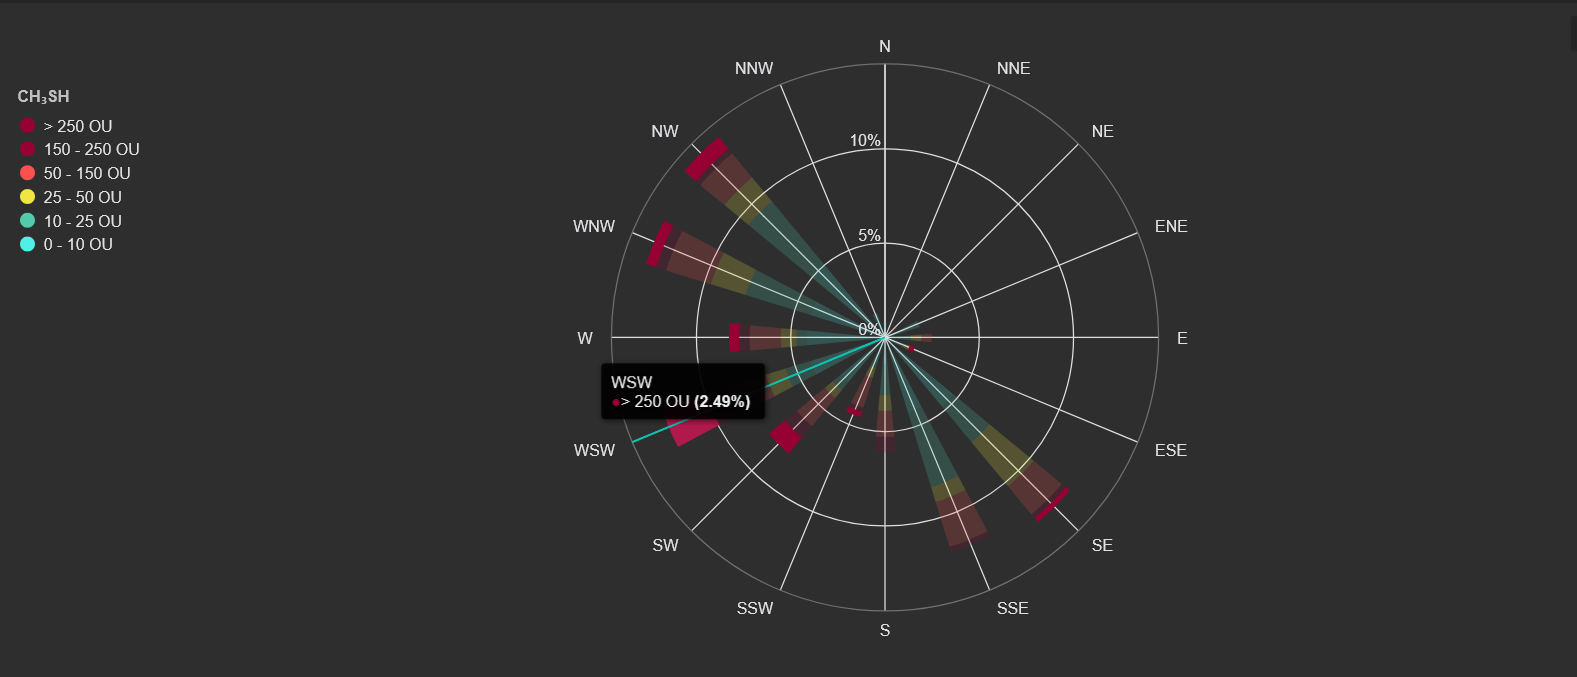
- Built-in Wind Data: Each reading is paired with wind speed and direction. Odour roses then show which direction high concentrations arrive from.
- Dust in the Same Frame: Dustroid Pro tracks PM₁ through PM₁₀₀ and was mounted beneath Odosense, so both devices sampled the same air.
- Portable Source Auditing: Pollusense allowed the team to walk the site and measure at individual points, confirming what the fixed monitors suggested.
- Site-specific Rating Bands: Thresholds for each gas were set so that a "Moderate" rating corresponds to the point at which most people find the air smelly.
The Deployment
The study ran in three phases, moving from the boundary inward and then to individual sources.
- Perimeter Monitoring (4–18 June 2025): Odosense Smart and Dustroid Pro were installed outside the site to capture what neighbours would experience.
- Interior monitoring (18 June – 3 July 2025): The team relocated both devices inside the plant to observe odour closer to its source.
- Walk-through audit (3 July 2025): The team used Pollusense to measure at seven points across the site. For comparison, they also measured at a poultry breeding and hatching facility the same day.
| Category | Parameters Measured | Device |
| Odour Gases | CH₃SH, H₂S, NH₃, SO₂, TVOC | Odosense Smart, Pollusense |
| Particulate Matter | PM₁, PM₂.₅, PM₁₀, PM₁₀₀ | Dustroid Pro, Pollusense |
| Meteorology | Temperature, humidity, atmospheric pressure | Odosense Smart |
| Wind | Wind speed, wind direction | Odosense Smart |
Rating bands were configured for each odour parameter before the study began:
| Rating | CH₃SH (OU) | H₂S (OU) | NH₃ (OU) | SO₂ (OU) | TVOC (ppm) |
| Good | 0 - 19.6 | 0 - 1.54 | 0 - 0.31 | 0 - 1.83 | 0 - 0.15 |
| Fair | 19.6 - 58.8 | 1.54 - 3.85 | 0.31 - 0.39 | 1.83 - 5.49 | 0.15 - 0.5 |
| Moderate | 58.8 - 98 | 3.85 - 7.69 | 0.39 - 1.95 | 5.49 - 9.15 | 0.5 - 0.6 |
| Poor | 98 - 1,960 | 7.69 - 153.84 | 1.95 - 5.85 | 9.15 - 12.81 | 0.6 - 0.8 |
| Very Poor | 1,960 - 19,600 | 153.84 - 769.2 | 5.85 - 9.75 | 12.81 - 18.3 | 0.8 - 1 |
| Extremely Poor | > 19,600 | > 769.2 | > 9.75 | > 18.3 | > 1 |
Results
The data showed a clear gradient: odour was mostly low at the boundary, sharply higher inside the plant, and highest at two specific points. Methyl mercaptan was the dominant odour driver throughout.
At the Boundary: Generally Acceptable, with Distinct Events
- CH₃SH averaged 6–7.5 OU, inside the "Good" band. Three events stood out: 159 OU on the morning of 11 June (06:45–07:20), 33 OU just after midnight on 15 June, and 113 OU sustained for roughly 18 hours from the evening of 15 June.
- H₂S stayed low, averaging about 0.05 OU, with a brief rise to 1–1.15 OU between 11 and 12 June.\
- NH₃ followed the working day, holding at 0.1–0.2 OU from dawn to dusk and dropping to zero at night. That pattern points to operational activity rather than a constant background source.
- Most readings arrived on southerly winds, indicating the direction from which on-site emissions reached the monitor.
Inside the Plant: Frequent, Intense Peaks
- CH₃SH peaked eight times between 1,037 and 3,146 OU over two weeks. Four of those peaks reached the "Very poor" band, and the highest interior peak was about 20 times the highest boundary reading.
- Peaks were not confined to one shift. They occurred in the early morning (05:30, 06:10), afternoon, and evening, suggesting several activities contributed.
- H₂S and NH₃ rose in step with CH₃SH. Sulphur and nitrogen compounds rising together is typical of decomposing animal matter, pointing to a common source.
- TVOC peaked in the early hours, exceeding 1 ppm on 27 June and reaching 0.6 ppm on 28 June and 0.5 ppm on 30 June.
- Elevated readings came mainly from the south and south-west.
Dust: Overnight Peaks, One Linked to Odour
Dustroid Pro recorded six particulate peaks, most between 23:45 and 06:45. The highest was 113 µg/m³ PM₁₀₀ and 88 µg/m³ PM₁₀ at 04:00 on 19 June. The 11 June peak (91 µg/m³ PM₁₀₀ at 06:45) coincided exactly with the boundary's largest CH₃SH event. That overlap suggests a single early-morning activity released both dust and odour.
The Audit: Two Hotspots Confirmed
The Pollusense walk-through located the sources the fixed monitors had pointed towards.
| Location | CH₃SH (OU) | NH₃ (ppm) | TVOC (ppm) | PM₁₀ (µg/m³) | Rating (CH₃SH) |
| Biofilter Area | 22,360 | 7.46 | 3.24 | 817 | Extremely poor |
| Dead-stock Receiving Area and Building | 12,559 | 8.03 | 2.74 | - | Very poor |
| Poultry Breeding and Hatching Facility (Comparison) | 24–40 | - | 0.22 | 10 | Fair |
The biofilter reading was the only measurement classified as “Extremely Poor,” at approximately 3,000 times the boundary average. As the biofilter treats exhaust air before release, this indicates poor filtration performance.
At the dead-stock receiving area, ammonia exceeded 8 ppm, well above the 5 ppm threshold at which its odour becomes pungent. Ammonia above 8 ppm was also recorded at the biofilter tower outlet, indicating inadequate removal before discharge.
High ammonia can impair the bacteria responsible for biological filtration, while elevated PM indicates that the filter’s water-spraying system may have been clogged or malfunctioning. The hatchery comparison confirmed that these elevated levels were specific to processing rather than poultry operations generally.
Impact
In one month, the plant replaced assumptions about odour with a measured account. It found its boundary generally within acceptable levels, while frequent, intense interior peaks pointed to the biofilter and dead-stock handling as key sources.
The findings led to a significant investment: the plant replaced its biofilter based on the Pollusense audit. It also moved towards monitoring the entire site with additional 6 Odosense and 3 AQBot units, enabling continuous verification of odour and air quality conditions.
For a business built on consumer trust, the wider value is credibility. Transparent, continuous data lets the plant show neighbours and regulators what it is doing and how well it is working. That strengthens its standing as a responsible operator in its community.
About Oizom
Oizom’s innovative technology has redefined environmental monitoring by providing highly accurate and actionable data on various atmospheric parameters. Our offerings include weather stations, pollution tracking, and noise monitoring solutions. With seamless integration into smart city infrastructure, Oizom’s tools enhance decision-making, compliance monitoring, and community engagement towards a greener planet.



Case Studies



.svg)



.webp&w=3840&q=75)