
At a Glance
A humidity sensor is a device that measures atmospheric water vapor concentration to help farmers predict crop water loss and schedule irrigation with precision. As relative humidity decreases, vapor pressure deficit increases, and both crop transpiration and irrigation requirements increase. Humidity data, when combined with temperature, wind speed, and solar radiation, provides the basis for ET₀-based irrigation scheduling, which reflects the globally accepted method of calculating actual crop water requirement (FAO Penman-Monteith, Irrigation and Drainage Paper No. 56).
In India, continuous humidity measurement is being mandated by PMFBY (Pradhan Mantri Fasal Bima Yojna) agricultural insurance programs for automated, weather-based claim verification and is being promoted under the ICAR Precision Agriculture Mission Program for data-driven irrigation scheduling. Implementing humidity sensors on farms or through agricultural technology companies enables users to reduce irrigation water use by 20-35% without adversely affecting yields, while meeting the compliance requirements of India’s evolving agricultural policy framework.
Introduction
For precision farmers, a single humidity reading at 6 a.m often provides more actionable irrigation insight than an entire week of fixed watering schedules. Unfortunately, most farms and agri-tech projects aren’t taking advantage of this technology. If you’re developing a crop insurance workflow based on PMFBY-compliant irrigation scheduling software or managing greenhouse climate control systems, this guide will help answer your deployment-specific questions rather than provide basic sensor principles.
The agriculture industry is under pressure due to increasing climate instability. The monsoon seasons that generations of farmers have depended on for growing crops are being disrupted; rising temperatures and water shortages are increasing, affecting most of the agricultural states. As a result, agricultural stakeholders across the value chain urgently need to move beyond guesswork.
Why Is Predicting Crop Moisture Needs Getting Harder
These 3 major trends are undermining the reliability of conventional rainfall forecasting.
- Monsoon Unpredictability: Monsoon rains have become unpredictable in their timing and spatial distribution over the last two decades, according to the IMD. The southwest monsoon in India contributes approximately 70% of the country’s annual total rainfall. Historically, farmers relied on both the timing of the monsoon rains and regular seasonal patterns; currently, farmers are experiencing both drought and flood years (and, in some cases, both in the same district).
- Accelerating Evapotranspiration: As the average global temperature increases, the rate at which crops and soil lose moisture to the atmosphere also increases. The FAO’s Penman-Monteith equation remains the world’s most widely used equation for determining reference ET₀; it includes humidity as one of its inputs. In years with lower humidity, ET₀ will, therefore, be higher than in previous years for the same amount of rainfall.
- Irrigation Inefficiency: According to ICAR estimates, 30-40% of the water supplied for irrigation is lost due to over-application or fixed-interval application, rather than using reasonable crop water indicators. Correcting this will require knowing what crops actually require, given the current growing conditions, rather than what they are scheduled to receive based on tradition.
What are Humidity Sensors, and How Do They Work?
Humidity sensors, also known as hygrometers, measure the concentration of water vapor in the air, typically expressed as relative humidity (RH, %). In agricultural monitoring, they are deployed at canopy height in open fields, integrated into greenhouse climate control systems, or mounted on weather stations at farm perimeters.
The 3 Main Types Of Humidity Sensors Used In Agricultural Contexts:
- Capacitive Humidity Sensors: These measure moisture levels by monitoring changes in electrical capacitance as moisture content varies; they also offer high accuracy (typically ±2 to 3% RH), long-term stability, and operate over a broad humidity range (0 to 100% RH). Therefore, capacitive humidity sensors are commonly used in both open-field and greenhouse settings.
- Resistive Humidity Sensors: Resistive humidity sensors measure moisture levels by monitoring changes in electrical conductivity. They are lower-cost than capacitive sensors but are more prone to contamination and drift due to high dust levels common in agricultural environments.
- IoT-Enabled Digital Humidity Sensors: Combine sensing capability with wireless connectivity (LoRaWAN, 4G, NB-IoT) for real-time data transmission to centralized dashboards. Essential for large-scale field deployments where manual data collection is not feasible.
Why Does Air Humidity Directly Affect Crop Water Demand?
Evapotranspiration (ET) is the combined process of water evaporating from the soil surface and transpiring from plant leaves, and it determines crop water demand in relation to humidity. Low relative humidity increases the vapor pressure deficit (VPD) between the air surrounding the plant and the plant’s internal environment, causing the plant to lose more water through the stomata. Conversely, when relative humidity is high, the VPD is low, so water loss through the stomata slows.
The practical manifestation of this ET/Humidity Relationship is that a field with the same crop, temperature, and soil moisture may require very different irrigation depending on environmental humidity levels on any given day. This table illustrates the range of optimal humidity levels and the relative risk associated with distinct crop types.
Crop | Optimal RH Range | Critical Growth Stage | Risk Below RH Threshold | Risk Above RH Threshold |
Wheat | 40–70% | Grain filling | Increased water stress, reduced yield | Fungal disease risk (rust, powdery mildew) |
Rice / Paddy | 70–90% | Flowering | Reduced pollination success | Blast disease and sheath blight risk |
Maize / Corn | 50–80% | Tasselling | Heat stress, pollen viability loss | Gray leaf spot and northern leaf blight |
Cotton | 50–70% | Boll formation | Premature boll drop | Boll rot and increased pest pressure |
Greenhouse Vegetables | 60–80% | All stages | Tip burn, wilting, reduced fruit set | Botrytis and downy mildew infection |
Sugarcane | 70–85% | Grand growth phase | Reduced juice content, stunted growth | Red rot and smut susceptibility |
Tea / Coffee | 70–90% | Flush/berry development | Leaf scorch and twig dieback | Blister blight and black rot risk |
Indicative RH thresholds derived from published crop science research and validated through Oizom’s field-monitoring deployments and agronomic advisory inputs across greenhouse and open-field agricultural environments.
Evapotranspiration: The Science Connecting Humidity To Irrigation Needs
Evapotranspiration is an important variable linking atmospheric conditions to the water needs of crops; one of its key inputs is humidity. The Penman-Monteith equation (FAO Irrigation and Drainage Paper No. 56) is the reference method for determining ET₀, as adopted by the FAO. It contains 4 primary parameters: air temperature, solar radiation, wind speed, and relative humidity. The Penman-Monteith equation can be summarized as follows:
In simplified terms: ET₀ = f(temperature, solar radiation, wind, humidity). When humidity drops by 20% on a hot afternoon, ET₀ can increase by 30–50%, meaning a crop that needed 4mm of water in the morning may need 5.5–6mm by midday under the same temperature and wind conditions. Fixed-schedule irrigation systems cannot respond to this. Sensor-driven systems can.
“Humidity is often the earliest atmospheric signal that irrigation demand is about to change. When interpreted alongside temperature, wind, and solar radiation, it becomes one of the most actionable inputs in precision irrigation planning.”
— Sohil Patel, CTO, Oizom
The 4-Step Humidity-to-Irrigation Workflow
1.Measure real-time RH using canopy-height sensors
Capture accurate atmospheric moisture conditions at the crop level.
2. Calculate vapor pressure deficit (VPD)
Translate RH and temperature into atmospheric water-demand intensity.
3. Run Penman-Monteith ET₀ calculations
Combine humidity, solar radiation, and wind data to estimate crop water loss.
4. Trigger irrigation when the crop water deficit reaches threshold
Automate irrigation decisions based on actual crop demand rather than fixed schedules.
India Focus: Regulatory And Scheme Context For Humidity Monitoring
India’s agriculture sector is increasingly supported and regulated by a policy environment that creates direct demand for field-level humidity and weather monitoring. The following frameworks are directly relevant to precision agriculture deployments:
Scheme / Policy | Governing Body | Relevance to Humidity Monitoring |
PM-KUSUM | Ministry of New & Renewable Energy | Solar-powered pump scheme weather and humidity data are increasingly required for pump scheduling and water audit compliance |
PMFBY Crop Insurance | Ministry of Agriculture | Automated weather station data, including humidity, is mandatory for weather-based crop insurance claim validation |
ICAR Precision Agriculture Mission | Indian Council of Agricultural Research | Promotes IoT-based field monitoring, including humidity sensors for irrigation scheduling and crop stress detection |
National Clean Air Programme (NCAP) | MoEFCC / CPCB | Agri burning and dust monitoring, humidity data used to assess fire weather, and suppression of dust from tilling |
State Smart Agriculture Pilots | Maharashtra, Punjab, Karnataka, Telangana | State-level precision farming programme funding sensor deployment and real-time weather-humidity monitoring infrastructure |
The most significant near-term driver is PMFBY. As the government shifts crop insurance claim validation from manual assessment to automated weather station data, farms and agri clusters covered under PMFBY must maintain verifiable, continuous humidity and weather records. This creates a compliance requirement, not just an operational improvement for weather monitoring infrastructure.
Sector -Wise Application Of Humidity Monitoring
Humidity monitoring serves different priorities across crop systems.
Open-field Cereal Crops (Wheat, Maize, Sorghum)
The primary function is ET₀-based irrigation scheduling. Low humidity during grain filling in wheat, particularly in the Rabi season across Punjab and Haryana, drives rapid soil moisture loss that fixed-schedule irrigation consistently underestimates. Humidity sensors at 2m canopy height, combined with temperature and wind data, allow platforms to trigger irrigation 18–24 hours before crop stress becomes visible, protecting yield at the most critical growth stage.
Paddy / Rice Cultivation
Rice is India’s most water-intensive crop and is simultaneously grown in some of its most humid regions. The monitoring priority here shifts from irrigation triggering to disease risk management. When humidity remains above 85% for extended periods during flowering and grain filling, the risk of blast disease (Magnaporthe oryzae) and bacterial blight rises sharply. Humidity monitoring enables targeted fungicide application timed to actual disease-conducive conditions, reducing chemical use and protecting yield.
Protected Horticulture and Greenhouse Farming
Greenhouse operators face a dual challenge: maintaining humidity high enough to prevent heat stress and tip burn, while keeping it low enough to avoid botrytis, powdery mildew, and other humidity-driven fungal diseases. The optimal range is typically 60–80% RH, and excursions in either direction can affect both yield and quality within 24–48 hours. Continuous humidity monitoring, integrated with climate control systems, allows automated actuation of fans, foggers, and vents.
Plantation Crops (Tea, Coffee, Sugarcane)
For sugarcane, India’s second-most water-consuming crop, integrating humidity data with ET₀ calculations can reduce irrigation cycles by 15–25% without affecting juice content, delivering material cost savings across large plantation areas. For tea in Assam and Darjeeling, and for coffee in Karnataka, humidity monitoring is primarily used to suppress disease and optimize harvest timing.
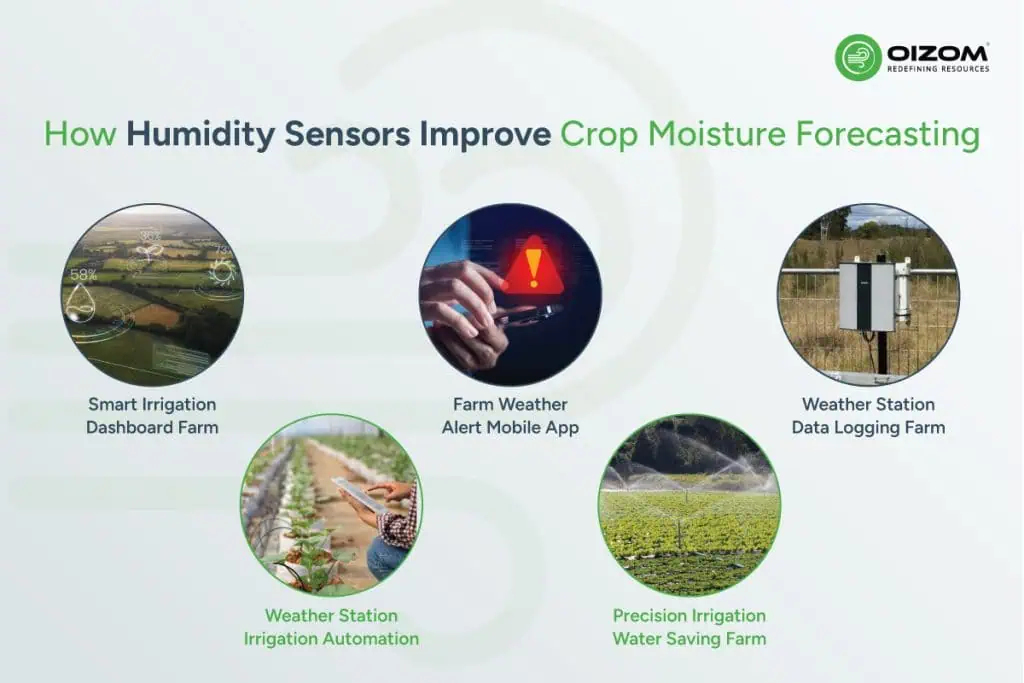
How Humidity Sensors Improve Crop Moisture Forecasting
When humidity sensors are deployed continuously, they transform irrigation management from reactive to proactive. The data allows agri-tech platforms and farm managers to:
Humidity Sensors vs Soil Moisture Sensors: A Direct Comparison
Humidity sensors and soil moisture sensors are often treated as interchangeable tools in precision agriculture, but they answer fundamentally different questions. A complete irrigation intelligence system requires both.
Parameter | Humidity Sensors | Soil Moisture Sensors |
Measures | Atmospheric water vapor (RH%) | Water available in the soil root zone |
Primary Purpose | Forecast crop water demand through ET₀ and VPD analysis | Measure current soil water availability |
Decision Insight | Predicts how much water crops will need | Shows how much water is already available |
Response Timing | Early warning of rising atmospheric demand | Confirms active root-zone depletion |
Best For | Irrigation scheduling, disease forecasting, greenhouse climate control | Irrigation validation, preventing under- or overwatering |
Typical Placement | Canopy height or weather station mast | Installed at the crop root depth |
Limjitation | Cannot confirm root-zone water status | Cannot predict future atmospheric water demand |
Best Practice | Combine with weather variables for ET₀ calculation | Combine with humidity-based forecasting for full irrigation intelligence |
How Integrated Environmental Monitoring Improves Forecasting Accuracy
Humidity sensors are valuable standalone devices, but they realize their full potential when integrated into a broader field-monitoring system that simultaneously measures multiple parameters.
A field-monitoring station that includes humidity, temperature, wind speed and direction, solar radiation, rainfall, and CO₂ concentration provides most of the parameters necessary to perform Penman-Monteith ET₀ calculations. Each of these parameters can affect irrigation requirements nonlinearly. A 10% decrease in humidity on a calm, cloudy day will result in different irrigation requirements than the same decrease on a hot, windy day with high solar radiation.
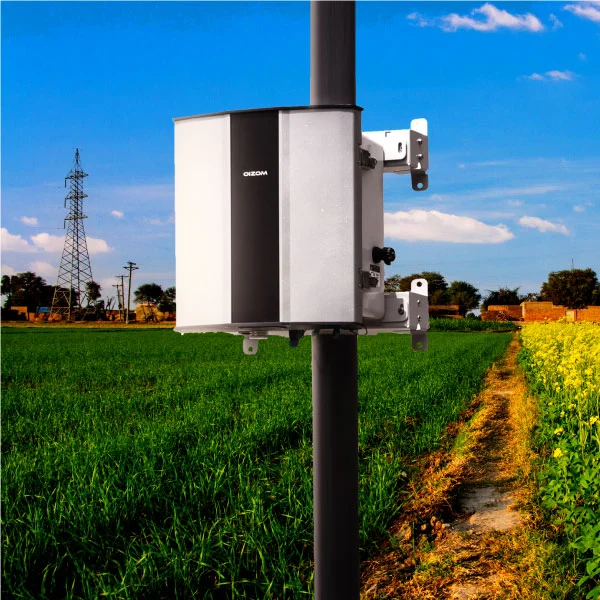
Weathercom measures all four Penman-Monteith inputs – temperature, humidity, solar radiation, and wind speed – in a single field-deployable unit, eliminating the data gaps that occur when parameters are sourced from separate sensors. It feeds directly into Oizom’s Envizom platform, where humidity trends, ET₀ calculations, and irrigation alerts can be monitored across multiple field locations from a single dashboard.
While Weathercom captures the four core Penman-Monteith inputs required for ET₀-based irrigation forecasting, broader environmental intelligence can be layered through systems like Polludrone for ambient air quality and particulate monitoring, and AQBot for fixed-site environmental surveillance in agri-industrial zones where dust drift, emissions, and external atmospheric disturbances may affect crop microclimates.
Case study: Department of Agriculture, Region IV-A, Philippines
In August 2025, the Philippines Department of Agriculture for Region IV-A partnered with Maedan Enterprise Inc. to deploy 11 Oizom Weathercom stations in Lobo, Batangas, under the AMIA programme (Adaptation and Mitigation Initiative in Agriculture), which is part of the national framework for climate change adaptation in agriculture.
The 11 weather stations continuously monitor temperature, relative humidity, precipitation, solar irradiance, wind speed/direction, and barometric pressure. The data collected by each station is transmitted in real time to Oizom through 4G and LoRaWAN using Oizom’s Envizom platform. All of these weather stations operate on solar power and have backup batteries; therefore, if there is a power outage, they will continue to operate, allowing continued monitoring of agricultural areas with limited or no infrastructure.
Through this deployment, DA Region IV-A obtained real-time microclimate data from weather stations, enabling data-driven planting schedules, irrigation decisions, and harvest timing rather than following preset calendar dates or manual records of field conditions. Now DA has the opportunity to use these tools to show their field officers and farmers how atmospheric conditions (e.g., humidity trends) can be translated into actionable decisions on irrigation and disease risk through the Envizom dashboards. The success of this approach in adopting climate-smart agricultural practices is now being promoted as a model for deploying them throughout the Philippines and to help meet the United Nations Sustainable Development Goals related to food security and climate action.
What A Well-Monitored Farm Looks Like
Deploying humidity sensors is not a one-time installation; it is a system that must be designed, integrated, and maintained to deliver reliable irrigation intelligence.
Month 0–1: Assessment and Sensor Network Design
- Identify priority crops, field sizes, and existing irrigation infrastructure
- Conduct a site survey for prevailing wind patterns, microclimatic variation, and proximity to water bodies or structures that create artificial humidity gradients
- Define monitoring approach: weather station at field perimeter, canopy-height sensors within plots, or greenhouse-integrated sensors
- Determine data transmission approach: LoRaWAN for large open fields, Wi-Fi, or 4G for greenhouse or cluster deployments
Month 1–2: Deployment and Integration
- Install calibrated sensors at defined heights (1.5–2m for open fields, 0.3–0.5m above crop canopy for greenhouse)
- Integrate with the central data platform and existing irrigation control or ERP systems
- Configure alert thresholds for crop-specific RH levels (reference crop RH table above)
Month 2–3: Baseline Establishment
- Run continuous monitoring without making irrigation changes, establish baseline RH, temperature, and ET₀ patterns
- Validate data quality: identify sensors showing drift, interference, or data gaps
- Begin correlating humidity readings with irrigation events and crop observations
Month 3 Onward: Operational Irrigation Management
- Activate ET₀-based or VPD-based irrigation triggers on the data platform
- Train farm operators and platform users to interpret humidity alerts and distinguish sensor anomalies from genuine atmospheric events
- Generate weekly and monthly humidity and ET₀ summaries for regulatory reporting (PMFBY, ICAR, ESG)
Weathercom measures all four Penman-Monteith inputs: temperature, humidity, solar radiation, and wind speed in a single field-deployable unit, eliminating the data gaps that occur when parameters are sourced from separate sensors.
The transition point that distinguishes high-performing deployments: when the farm operator stops checking the weather app and starts checking the sensor dashboard instead.
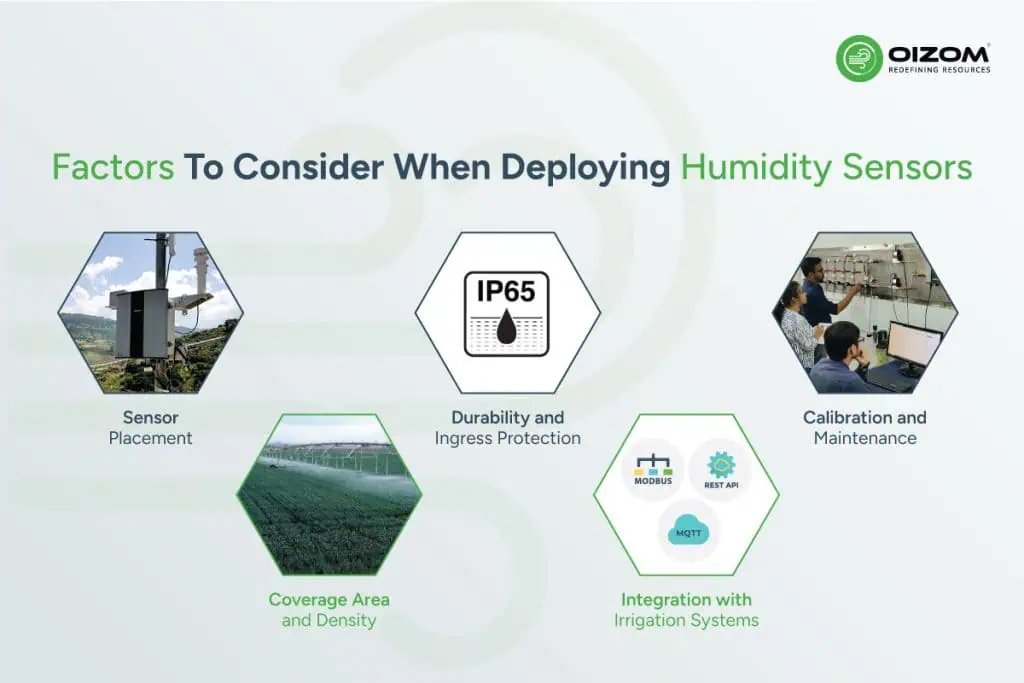
Factors To Consider When Deploying Humidity Sensors
Sensor Placement
For crops grown outdoors, you should mount sensors from 1.5 – 2m off ground level so they can measure humidity throughout the crop’s canopy. For crops grown inside a greenhouse or similar structure, install sensors 0.3 – 0.5m above the crop’s canopy in several locations throughout the entire structure. Depending on the structure’s size, there could be a 10-15% variation in RH across different areas of the greenhouse.
Coverage Area and Density
Use one sensor per 2-5 hectares for precise outdoor crop irrigation; use one sensor per 500-1000 sqm for crops grown in greenhouses. The more valuable the crop is, or the more stringent the compliance requirements, the greater the warranted sensor density.
Durability and Ingress Protection
You need to make sure that the sensor-0.5 m purchase can withstand extreme field conditions throughout India (0-100% humidity and -10 degrees Celsius to +60 degrees Celsius) and have at least an IP65 rating for outdoor use.
Integration with Irrigation Systems
Before deploying your new sensors, ensure that your sensors and the irrigation systems they are connected to use compatible communication protocols. Currently, MODBUS, MQTT, and REST API connectivity are the three most commonly used communication protocols in modern agri-tech.
Calibration and Maintenance
Calibrate each sensor every six (6) to twelve (12) months. Use each calibration event as documentation of compliance, and have the system automatically notify operators when drift occurs or other anomalies arise, rather than having operators manually detect such problems.
Common Humidity Sensor Deployment Failure Modes
The sensitivity of humidity sensors to their deployment location can lead to inaccurate irrigation intelligence, even when they are properly functioning. In addition, placing them too close to irrigation lines or wet soils will cause the sensor to record incorrect humidity levels for the entire area; it will record a high humidity immediately after the area has been watered, thus underestimating the crop’s water needs. Sensors located near bodies of water, in depressions, or in waterlogged areas often record localized humidity that does not accurately reflect the surrounding atmospheric conditions. Finally, sensors mounted too high or too low may also yield inaccurate readings, measuring ambient air temperature rather than crop stress. Errors resulting from placement will present as unexplained deviations in relative humidity readings relative to nearby stations, spurious spikes in humidity following irrigation events, and false ET₀ recommendations compared to visible crop stress. Periodic cross-checking of sensor data collected at different locations, as well as automated data anomaly detection using software such as Envizom by Oizom, will help prevent bias in irrigation decision-making caused by sensor placement errors.
Measurable Benefits Of Humidity-Based Crop Monitoring
- Water Efficiency: Irrigating based on ET₀ and real-time humidity readings has been shown to reduce water use by 20-35% in drip irrigation without sacrificing yield (FAO 2012; ICAR field trials).
- Yield Improvement: Greenhouse environments using sensor-guided weather control to maintain humidity within an optimal range have achieved yield increases of 20-25% compared with fixed-schedule management in controlled-growing trials.
- Disease Cost Reduction: Fungicide application timing based on humidity-triggered criteria in rice and tea has reduced unnecessary applications by 30-40 %, lowering input costs while maintaining the same level of disease control.
- Irrigation Labor Reduction: Using automated irrigation timers based on humidity values has reduced the number of manual irrigation decisions required throughout the growing year and lowered direct labor costs in large-scale agricultural operations.
- Regulatory and Insurance Compliance: There is a continuous record of humidity data collected with calibrated sensors that will satisfy the PMFBY (Pradhan Mantri Fasal Bima Yojana) requirements for weather data, allowing for the automatic validation of claims and reducing the burden of documentation for claiming benefits, thus shortening the processing time for all claims.
Conclusion
Humidity is not a supplementary environmental variable; but a key driver of crop water demand, disease risk, and irrigation efficiency. As India’s agricultural sector moves from experience-based to data-driven management, and as policy frameworks like PMFBY and the ICAR Precision Agriculture Mission create formal demand for continuous field monitoring, humidity sensors are transitioning from optional equipment to operational infrastructure. The farms, agri-tech platforms, and greenhouse operations that build humidity monitoring into their irrigation intelligence layer now will hold a measurable advantage in water efficiency, crop health, and compliance readiness over those that continue to rely on schedules and intuition. Data does not replace agronomic judgment. But in a season where a single humidity trend missed during grain filling is the difference between a yield and a loss, it sharpens it considerably.
FAQs
By driving the ET₀ calculation, the measure of how much water crops are actively losing to the atmosphere is obtained. When relative humidity drops, vapor pressure deficit rises, accelerating water loss through crop leaves. Platforms that integrate humidity, temperature, and solar radiation can dynamically calculate ET₀ and trigger irrigation based on the actual crop water deficit, eliminating both under- and over-irrigation.
They answer different questions. Humidity sensors forecast how much water crops will need based on atmospheric demand. Soil moisture sensors confirm how much is already available in the root zone. A complete irrigation intelligence system requires both to see the comparison table above.
All major crops benefit, but differently. Wheat and maize benefit through ET₀-based irrigation scheduling during critical growth stages. Rice benefits twice from irrigation efficiency during establishment and disease-risk management at flowering. Greenhouse vegetables require humidity control to maintain yield quality and prevent disease. Tea, coffee, and sugarcane benefit primarily through disease suppression and reduced irrigation cycles.
Yes. As India shifts PMFBY claim validation from manual crop-cutting to automated weather-station data, continuous humidity and weather records are becoming a compliance requirement. Farms with calibrated, continuously recording weather stations qualify for faster automated claim processing. The two non-negotiables: data continuity and calibration documentation.
Match the system to your scale and integration needs. For open fields, prioritize IoT-enabled capacitive sensors with LoRaWAN or 4G, IP65 protection, and ET₀ calculation support. For greenhouses, ensure multi-node support and MODBUS or MQTT compatibility. In all cases, evaluate the total cost of ownership over three years, including calibration, maintenance, and data downtime, not just upfront hardware cost.