Environmental Monitoring Glossary

The Language of Environmental Monitoring

Learn the lingo to navigate Environmental monitoring world and enhance your monitoring capability. Environmental monitoring glossary is Oizom’s efforts towards building a better knowledge centre around glossaries that are commonly used in the space of environmental monitoring.
Terms starting with

Scatter Plot

Definition

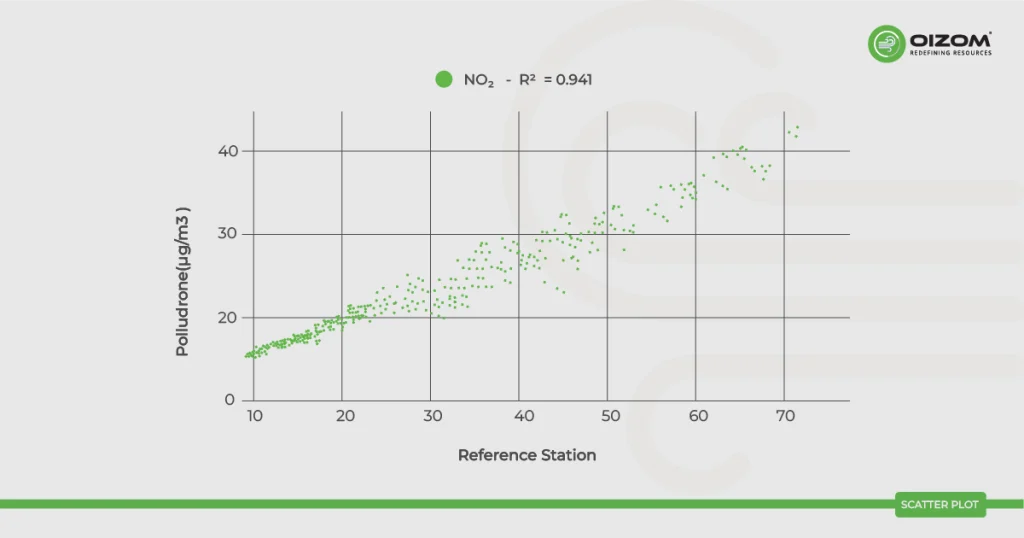
A scatter plot (aka scatter chart, scatter graph) uses dots to represent values for two different numeric variables. The position of each dot on the horizontal and vertical axis indicates values for an individual data point. Scatter plots are used to observe relationships between variables.

Scatter Plot

More Partnership Terms beginning with

Get Free Ecosystem advice

Stay updated on air quality monitoring news and updates

Brush up on the Latest Insights

Brush up on the Latest Insights

Learn the lingo to navigate Environmental monitoring world and enhance your monitoring capability. Environmental monitoring glossary is Oizom’s efforts towards building a better knowledge centre around glossaries that are commonly used in the space of environmental monitoring.

Think We Can Help You?

Get In Touch