Summary
Air pollution is the most severe environmental threat to public health globally, impacting health, development, and the environment. The top 10 most polluted cities in 2025 include Byrnihat, Delhi, Lahore, Karaganda, and Faridabad, among others, as discussed in the blog. The blog discusses the health, environmental impacts, and economic costs of air pollution. Major causes of pollution include the use of fossil fuels, vehicular emissions, industrial activities, agriculture, and inadequate waste management. Efforts like the Paris Agreement aim to combat these issues. The blog highlights the pressing need for sustainable practices and cleaner technologies, as exemplified by companies like Oizom, which offers advanced air quality monitoring devices and provides real-time, accurate data. However, if we practice and adopt sustainability towards a cleaner future, we will achieve SDG 3, 11, 13, and 15 for the urban environment.
Introduction
“Air doesn’t come with a price tag, yet polluted air may be the costliest thing we consume daily.”
In 2025, the global air pollution crisis, rising PM₂.₅ concentrations, and worsening urban smog levels have pushed several cities into hazardous AQI categories. The damage in this case rarely comes from a single event; instead, it quietly builds up in rising hospital admissions, lost productivity, and shrinking life expectancy. In industrial valleys and congested basins, where pollutants persist and quickly accumulate, the cost of dirty air becomes a story written not just in statistics but in everyday lives.
How Are “Most Polluted Cities” Determined?
Air quality monitoring involves collecting and analyzing ambient air pollution samples to assess levels. To evaluate air quality, data from these samples are compared with clean air standards, historical air quality data, and data on their effects on human health and the environment. First, let us understand the monitoring needs:
Identifying the purpose behind the monitoring of air quality:
- Your monitoring requirements may include tracking indoor pollution levels in your home or workplace, determining outdoor air quality for environmental projects, or ensuring compliance with industrial safety rules. Defining your unique needs might significantly reduce your options.
Which types of pollutants do you want to monitor:
- The EPA established National Ambient Air Quality Standards (NAAQS) for six common air pollutants, often referred to as “criteria” air pollutants, to protect human health and welfare nationwide. Among these, PM₂.₅ exposure is considered the most dangerous as it can penetrate deep into the lungs and bloodstream, significantly increasing long-term health risks.
Did you know that Oizom launched its latest innovation, Pollusense, in November 2024? It’s a portable air quality monitor that provides accurate, real-time data on pollutants and environmental conditions. Equipped with advanced sensor technology, Pollusense uses laser-based PID, MPS, and electrochemical sensors to detect particulate matter and gases, including NO₂, CH₄, and VOCs. This compact, portable device is ideal for industries, environmental audits, or anyone requiring flexible air-quality monitoring on the go. With Pollusense, you get accurate insights wherever you are, ensuring you stay informed at all times.
Why does Pollusense truly stand out in the air quality monitoring space?
Because we don’t just build monitors; we build trust in data. Every Oizom air quality monitoring device is first calibrated in an ISO/IEC 17025:2017-certified lab using NIST-traceable gas standards, strictly following international guidelines (U.S. EPA Vol. II, Section 6.0, Rev. 1).
But we don’t stop there.
After lab calibration, each device undergoes a second level of testing, involving collocation with a custom-built reference station equipped with U.S. EPA-designated Federal Equivalent Method (FEM) analyzers. This double-layered approach ensures that Pollusense delivers data you can depend on every single time.
The Top 10 Most Polluted Cities in the World:
It’s said that the air we breathe is the essence of life. However, for residents of the following cities, the air they breathe daily might be far from pure. Air pollution has become a primary global concern in the last few decades, leading to numerous health and environmental challenges. Here’s a look at the world’s top 10 most polluted cities and the pressing need for change. Below, I will discuss the world’s most polluted cities in 2025.
World’s Most Polluted Cities in 2025
According to a 2024 World Air Quality Report by IQAir, 91.3% of countries and regions failed to meet the WHO’s safe air quality standards for PM₂.₅ pollution. Based on the World Air Quality Rankings 2025 and the highest annual PM₂.₅ concentration data, the following cities recorded the most alarming pollution levels.
1.Byrnihat
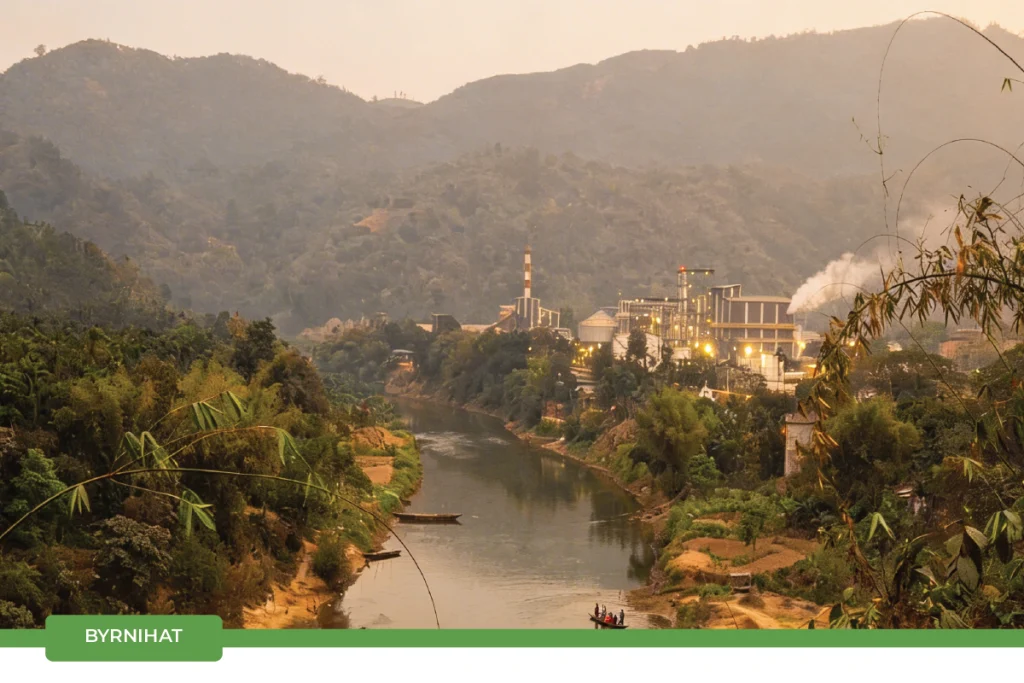
- Byrnihat indicates one of the fastest-growing industrial pollution zones in South Asia
- Health Impact: Long-term exposure escalates the risk of lung disease and cardiovascular problems
- Who’s at Risk: Factory workers, residents, children, and elderly populations.
- Key Concern: Industrial emissions and limited dispersion due to topography contribute to prolonged unsafe air conditions
- Urgency: Calls for stricter industrial emission controls and continuous air quality monitoring
2.Delhi
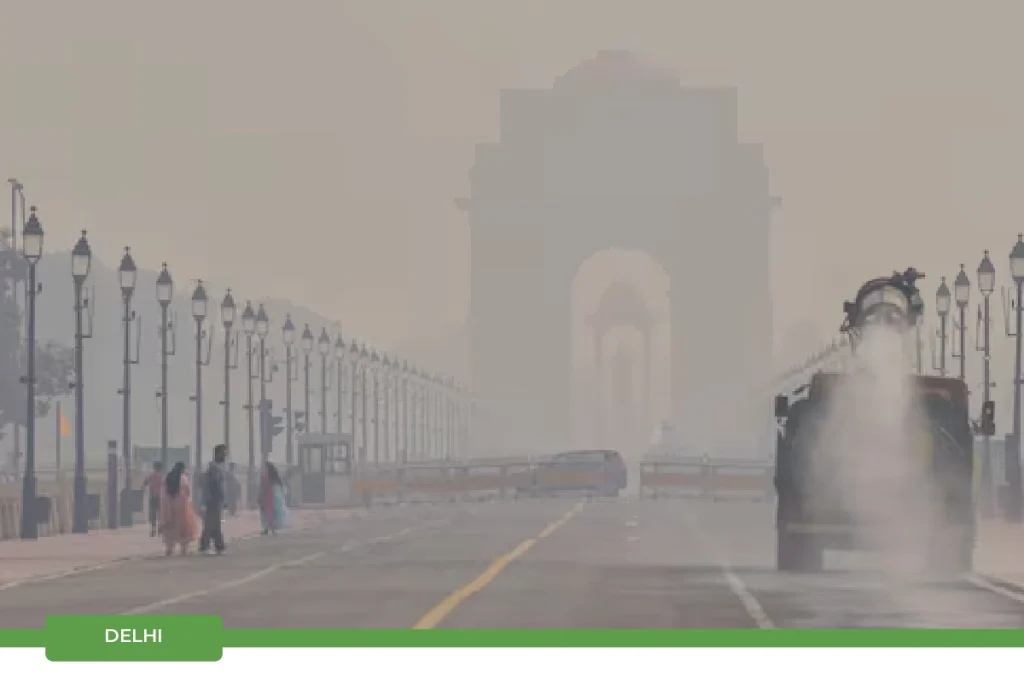
- Delhi remains a high pollution area, frequently crossing severe AQI levels during winter
- Health Impact: Breathing contaminated air can increase the risk of respiratory illnesses and long-term chronic diseases
- Who’s at Risk: Everyone, especially children, the elderly, and individuals with already existing lung or heart conditions
- Key Concern: Pro-longed, extreme PM₂.₅ concentrations complicate mitigation efforts
- Urgency: Highlights the need for aggressive enforcement of pollution controls, rapid transition to clean energy, and region-specific urban planning
3.Karaganda
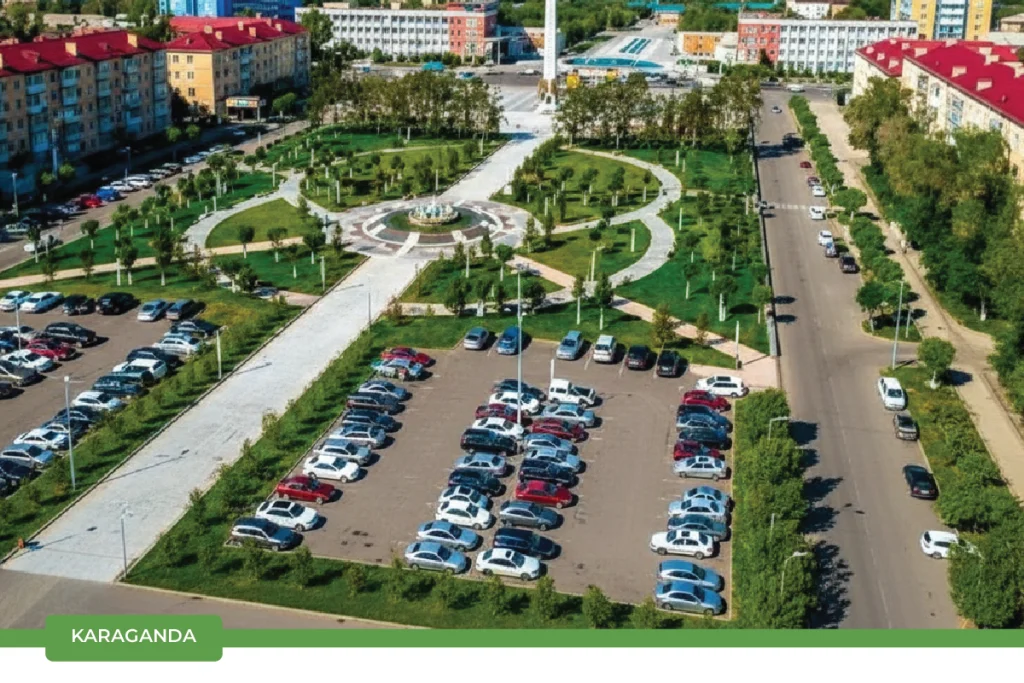
- Health Impact: Increased risk of respiratory infections and chronic obstructive pulmonary disease (COPD)
- Who’s at Risk: Industrial workers, elderly residents, and those with pre-existing lung conditions
- Key Concern: Coal-based energy production and heavy industry significantly contribute to particulate pollution.
- Urgency: Requires transition toward cleaner energy and stricter industrial regulations
4.Mullanpur
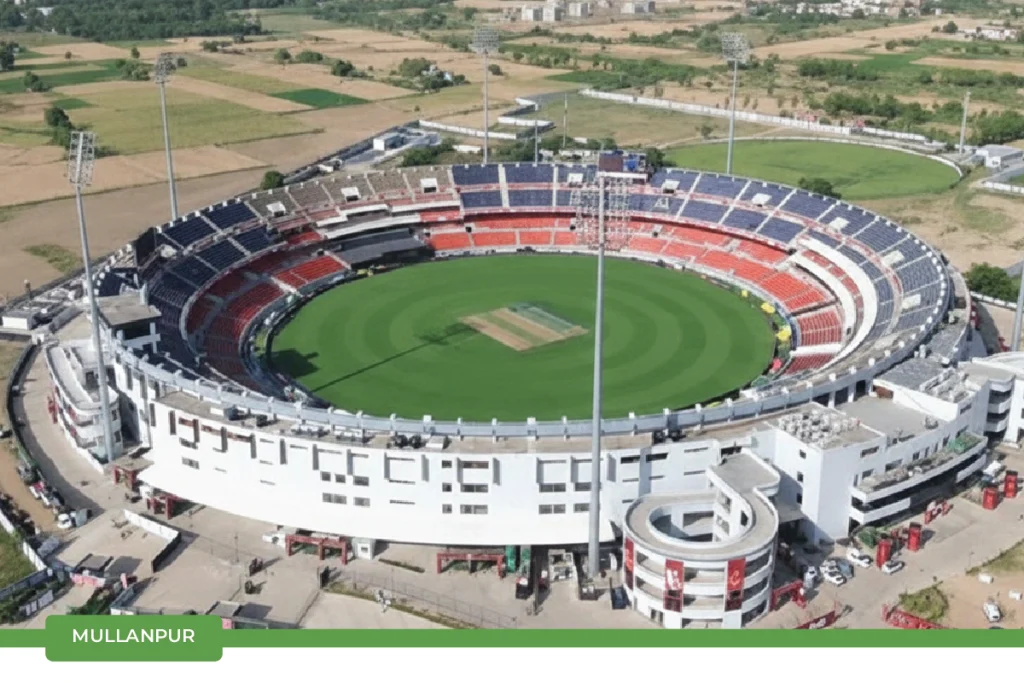
- Health Impact: Continuous exposure can lead to persistent coughing, throat irritation, and long-term lung damage
- Who’s at Risk: Children, elderly residents, and nearby construction workers
- Key Concern: Rapid urban development and construction dust are major contributors to degraded air quality
- Urgency: Strengthening dust-control measures and enforcing environmental compliance are critical
5.Lahore

- Lahore continues to battle recurring smog emergencies and cross-border pollution challenges
- Health Impact: Breathing the air is equivalent to smoking around two cigarettes a day
- Who’s at Risk: Children, the elderly, and those with respiratory conditions
- Key Concern: Toxic air continues to pose a daily health hazard despite ongoing mitigation efforts
- Urgency: Highlights the need for stricter enforcement, cleaner fuels, and sustainable urban planning
6.Faridabad
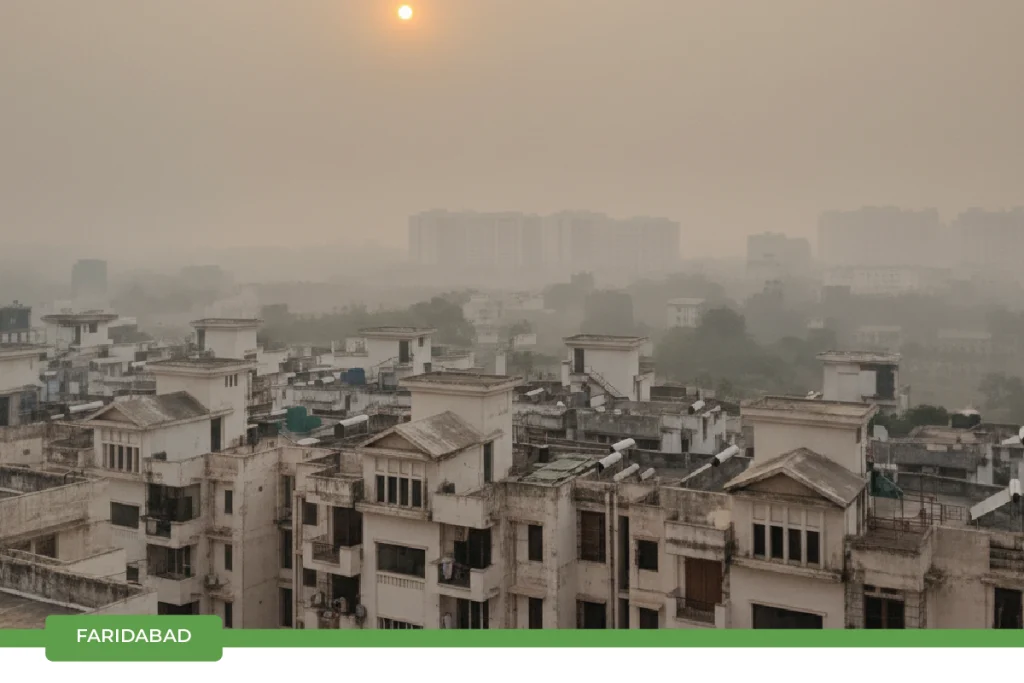
- Health Impact: Increased risk of cardiovascular strain and chronic respiratory problems
- Who’s at Risk: Industrial laborers, traffic police, and vulnerable populations
- Key Concern: Dense industrial clusters and vehicular congestion elevate particulate matter levels
- Urgency: Calls for stricter industrial audits and expansion of green mobility solutions
7.Dera Ismail Khan

- Health Impact: Regular exposure can trigger asthma attacks and worsen lung inflammation
- Who’s at Risk: Children, elderly individuals, and outdoor workers
- Key Concern: Dust storms and vehicular emissions combine to create persistently poor air conditions
- Urgency: Highlights the need for improved urban dust management and emissions regulation
8.N’Djamena

- Health Impact: High particulate exposure increases the risk of respiratory infections and reduced life expectancy
- Who’s at Risk: Children, pregnant women, and communities with limited healthcare access
- Key Concern: Desert dust, combined with limited pollution-control infrastructure, exacerbates air-quality challenges
- Urgency: Strengthening monitoring systems and regional air management policies is essential
9.Loni
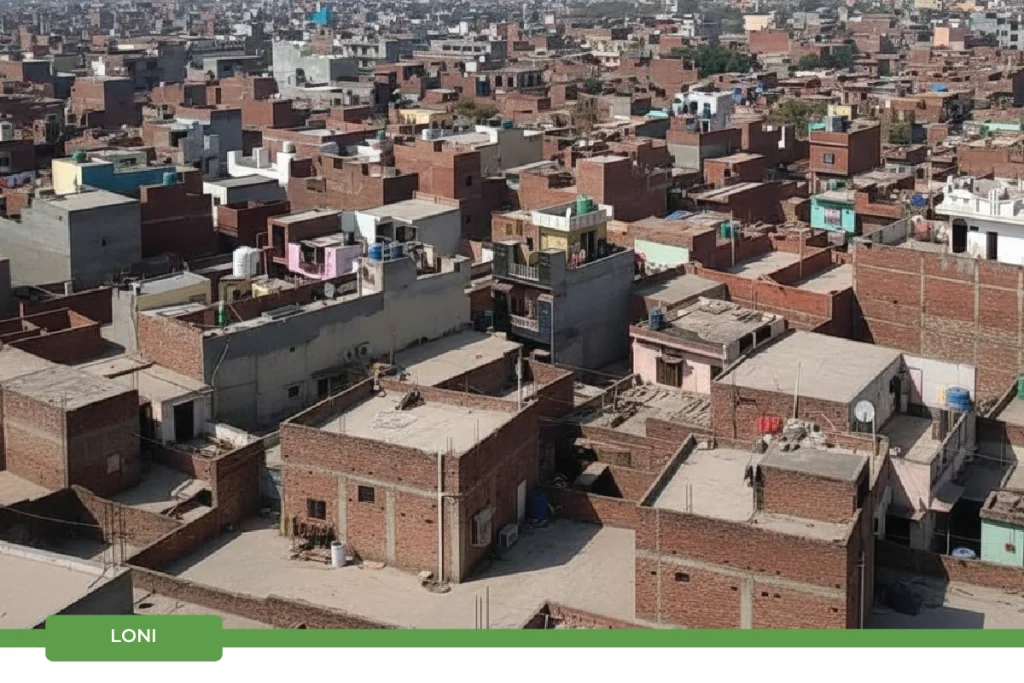
- Health Impact: Can cause breathing discomfort and aggravate chronic respiratory illnesses
- Who’s at Risk: Residents in dense housing clusters and informal sector workers
- Key Concern: Proximity to industrial belts and high vehicular density worsen air quality levels
- Urgency: Requires coordinated regional planning and industrial emission reductions
10.Dhaka
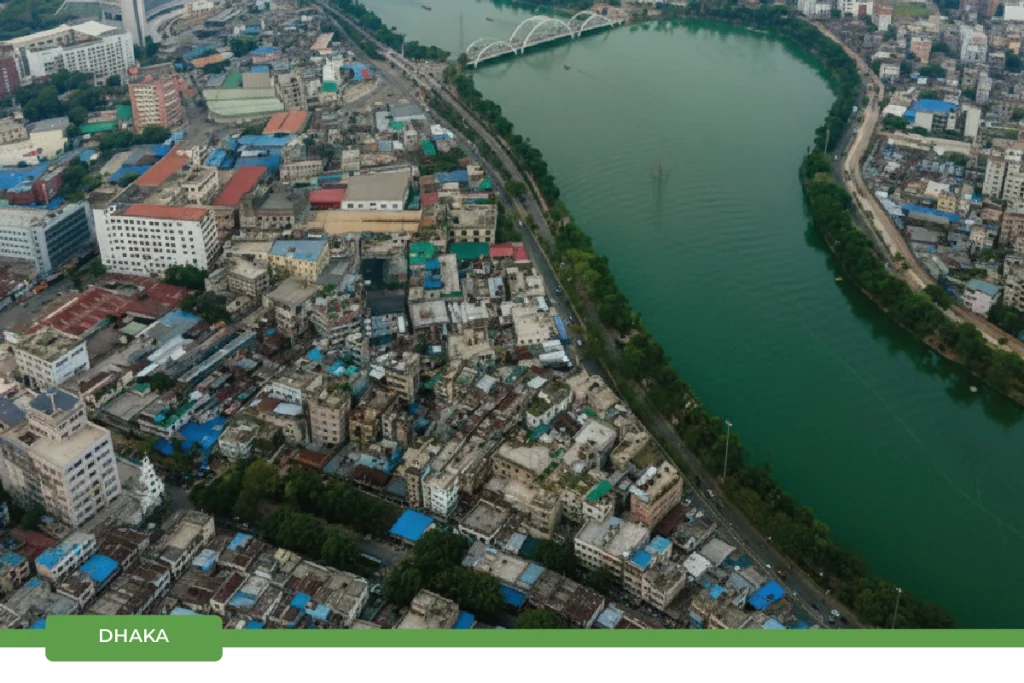
- Health Impact: Long-term exposure increases the risk of chronic respiratory and cardiovascular diseases
- Who’s at Risk: Children, elderly populations, and outdoor workers
- Key Concern: Rapid urbanization, brick kilns, and vehicular emissions contribute significantly to PM₂.₅ levels
- Urgency: Requires stricter emission controls and sustainable urban transport systems
This ranking is based on live PM₂.₅ data seen at the moment of writing this blog, along with trends from previous years. Air quality differs daily due to weather, seasonal changes, and local activities, so accurate numbers may vary when viewed later. However, the cities listed here are the regions that regularly rank among the world’s most polluted in terms of average air quality.
What Drives Pollution in These Cities?
Key contributors include vehicular emissions, fossil fuel combustion, industrial emissions, construction dust pollution, and biomass burning. However, it’s a mix of urban growth, industrial expansion, and poor environmental supervision. In parts of Delhi, Faridabad, and Lahore, vehicular emissions remain significant contributors. Millions of vehicles run daily, with many depending on fossil fuels, releasing fine particulate matter (PM₂.₅, PM₁₀) and nitrogen oxides that trap heat and aggravate smog.
Industrial zones pose an additional hurdle due to the release of sulfur oxides, volatile organic compounds (VOCs), and toxic dust, which rapidly accumulate under weak-wind conditions. Such hotspots often record AQI levels higher than those in major capitals.
Construction and infrastructure growth also play a significant role. Dust from construction sites, roadwork, and unpaved areas primarily adds to PM levels. Without proper dust control measures, every new building or highway project affects air quality in the short term.
Seasonal and geographical factors further increase the problem. Northern Indian cities experience stubble burning every autumn, particularly in Punjab and Haryana, which drives harmful smoke into the Delhi NCR region. In contrast, cities in industrial hubs like Byrnihat suffer from poor air circulation, which traps pollutants near the ground.
Finally, energy demand binds everything together. Heavy dependence on coal-based power plants and diesel generators keeps pollution levels high. While the use of cleaner fuels and renewables is increasing, most of these cities still rely on coal and diesel, ensuring that air-quality challenges persist year-round.
Health & Economic Costs
The impact of toxic air extends beyond the environment to people’s lives. Exposure to elevated levels of PM₂.₅, NO₂, and ozone for prolonged periods is associated with an increased risk of respiratory diseases such as asthma, chronic bronchitis, and even lung cancer. Studies link prolonged air pollution exposure to increased cases of cardiovascular disease, asthma attacks, reduced life expectancy, and pollution-related deaths. In highly polluted cities such as Delhi, infants and the elderly are at the greatest risk, and studies have shown a dramatic increase in hospitalization rates during peak smog seasons.
The financial cost is equally scary. According to some World Bank estimates, air pollution costs nations around 8% of GDP due to lost workforce productivity, healthcare costs, and premature mortality. The economic cost of air pollution remains one of the biggest barriers to sustainable development. In industrial towns, employees are exposed to poisonous dust and smoke, resulting in significant losses that can trigger a chain reaction affecting both local and national economies.
Regular sickness results in fewer school days for kids and fewer working hours for adults. In smog-tainted cities like Dhaka and Lahore, absenteeism rises, while productivity falls. Hidden costs, though never headline news, significantly impact households and businesses alike.
Health care systems in areas with high pollution levels are often the hardest hit. Cases of respiratory issues during peak seasons are increasing, placing extra burdens on both governments and individuals. Together, these economic and health expenses illustrate that air pollution is not only an environmental issue, but it’s also a development obstacle. Not only is cleaner air a public health requirement, but it is also an economic necessity for cities looking to develop sustainably.
Looking Ahead: Can Air Quality Improve?
Although current numbers create a bleak picture, the air quality story is still evolving. Cities such as Lahore, Delhi, and N’Djamena were once among the top polluters. However, due to concerted policy efforts, cleaner fuels, and civic enlightenment, they have turned around decades of dirty air. This gives hope that Indian and international hotspots might turn around with equal tenacity.
Technology is already unlocking possibilities. From basic sensors tracking local pollution to AI-based forecasting systems, data is providing citizens and authorities with more insights into when and where action is required. Renewable energy take-up, stricter emission standards, and more intelligent city planning are also increasingly progressing, though not steadily.
With booming populations and industrial demands, gains can feel like two steps forward, one step backward. Yet every major step back in particulate matter or nitrogen oxides reduces doctor visits, improves health, and makes economies more efficient. The path may be gradual, but it’s quantifiable and significant.
The future is a delicate balancing act: meeting development needs without compromising clean air. With increased enforcement, new technologies, and community accountability, even the world’s most polluted cities stand a chance of redeeming their air-quality narrative within the coming decade.
Conclusion
Clean air is invisible, but its value is undeniable. Achieving cleaner air aligns directly with SDG 3 (Good Health), SDG 11 (Sustainable Cities), SDG 13 (Climate Action), and SDG 15 (Life on Land). The narrative is not fixed, progress is being made, though slowly and to some extent unevenly, and every measure taken to curb emissions reduces both the human and economic burden. What was once considered the inevitable cost of industrial growth is now viewed as a solvable challenge. Recognizing that polluted air is among the most expensive things we “consume” daily is the first step toward rewriting the story, one where the true wealth of a community is measured not in output, but in the clarity of the air its people breathe.
To wrap things up, this blog dives into the top 10 least polluted cities in India. I hope you find these insights helpful and interesting!
Related Topics
.webp&w=3840&q=75)
.webp&w=3840&q=75)
.webp&w=3840&q=75)
FAQs
Was this Helpful ?

.webp&w=1920&q=75)

.webp&w=1920&q=75)
.webp&w=1920&q=75)
