Air quality is essential to our health and the environment’s well-being. Its measurement is a nuanced process driven by precise scientific methods and cutting-edge technology. This intricate process involves tracking and evaluating various atmospheric pollutants that pose risks to humans, plants, animals, and the planet.
Over time, these methods have evolved, becoming more sophisticated and accurate, offering us better ways to safeguard our health and protect our planet.
This blog aims to delve into the nitty-gritty of measuring air quality, shedding light on the methods, parameters, and technologies involved in this significant environmental science endeavour.
Monitoring Stations and Networks
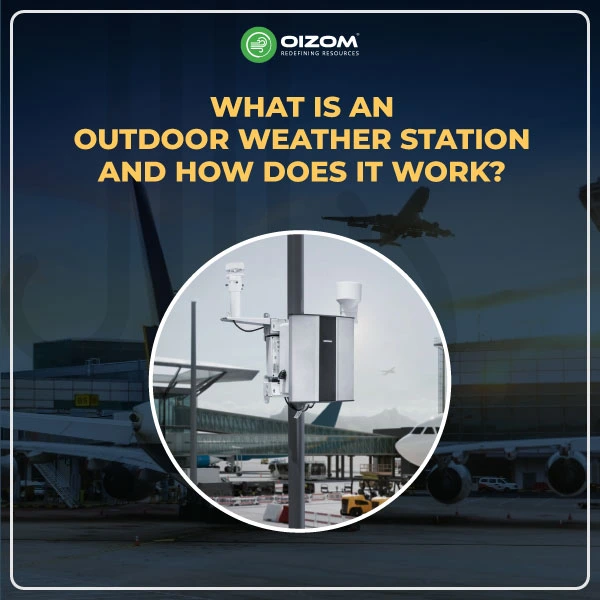
Air quality monitoring is typically performed at dedicated stations spread across cities, towns, and even remote rural areas. These stations form a comprehensive network, gathering vital data about the air we breathe. In the United Kingdom, for instance, the Automatic Urban and Rural Network (AURN) is the largest and most important of such networks.
It comprises numerous monitoring stations that rigorously follow EU directive monitoring requirements, thus ensuring consistency and comparability of data across various regions.
Monitoring stations are typically equipped with a plethora of sensors and analytical instruments. These sophisticated devices capture and measure different pollutants in the atmosphere, providing data in real-time or over set periods.
The locations of these stations are strategically chosen to capture a representative sample of the air quality experienced by the population and sensitive ecosystems.
Measurement Parameters
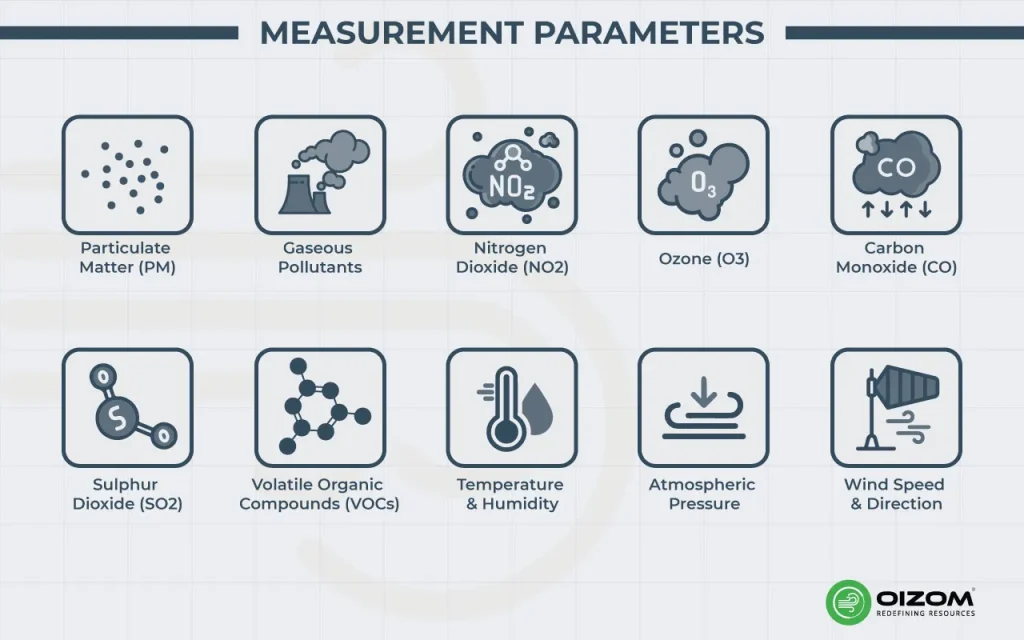
Air quality measurement is not a singular entity but a composite of various parameters. These parameters correspond to different pollutants known to impact health and the environment adversely. Let’s delve into the specifics of these parameters.
Particulate Matter (PM)
Particulate Matter (PM) represents a mixture of solid particles and liquid droplets suspended in the air. It is further categorised by size into PM10 (particles with a diameter of 10 micrometres or less) and PM2.5 (particles with a diameter of 2.5 micrometers or less).
Due to their small size, these particles can be inhaled deeply into the lungs, posing significant health risks. PM is primarily measured using high-volume air samplers, beta-attenuation monitors, or light-scattering devices.
Gaseous Pollutants
These are pollutants present in gaseous form. Various sophisticated methods are used to measure them, as discussed below.
Nitrogen Dioxide (NO2)
A primary pollutant emitted during fossil fuel combustion, Nitrogen Dioxide (NO2) is an integral part of urban smog and can cause respiratory problems. Chemiluminescence detectors are commonly used to measure NO2. The device induces a chemical reaction between NO2 and a known amount of ozone, producing a flash of light proportional to the NO2 concentration.
Ozone (O3)
Ozone, a crucial constituent of the upper atmosphere, can be harmful at ground level, causing breathing difficulties and damaging plants. Ultraviolet photometric analysers measure ozone by shining a UV light through an air sample and quantifying the absorbed light amount.
Carbon Monoxide (CO)
CO, a colourless, odourless gas, is hazardous when inhaled in large amounts. Non-dispersive infrared (NDIR) sensors are used to measure CO. These sensors exploit the fact that CO molecules absorb infrared light of a specific wavelength, allowing for accurate measurement.
Sulphur Dioxide (SO2)
SO2 is mainly produced by burning fossil fuels and can lead to respiratory problems and acid rain. Pulsed Fluorescence analysers are typically used for measuring SO2. The gas absorbs ultraviolet light and fluoresces (emits light), which is then measured.
Volatile Organic Compounds (VOCs)
Volatile Organic Compounds (VOCs) are a broad category of organic compounds that can easily become vapours or gases. Some VOCs are harmful when inhaled and can contribute to smog. They are typically measured using gas chromatography or photoionisation detectors.
Other Parameters
Air quality is also affected by weather conditions, which are thus essential components of measurement.
Temperature and Humidity
Temperature and humidity affect the concentration and dispersal of pollutants. For example, higher temperatures can speed up chemical reactions between pollutants, while humidity can affect the formation of secondary pollutants.
Atmospheric Pressure
Atmospheric pressure impacts the dispersion of pollutants. Lower pressure can lead to increased concentrations of pollutants at ground level.
Wind Speed and Direction
Wind speed and direction are crucial in determining the dispersion and movement of pollutants. For example, a strong wind can disperse pollutants, improving air quality in one area but potentially worsening it elsewhere.
Direct Sampling Methods
Direct sampling methods involve capturing a representative air sample for gaseous pollutants, which is then analysed in a laboratory. The two primary techniques are grab sampling, which collects a single sample at a specific time and location, and integrated sampling, which collects samples over a longer period.
Continuous Monitoring Techniques
Continuous monitoring techniques offer real-time data, providing a more comprehensive picture of air quality changes. These techniques typically involve stationary monitoring stations equipped with various sensors and analysers. Some techniques have been discussed earlier, such as chemiluminescence (for NO2) or ultraviolet absorption (for O3).
Reference Methods and Standardization
Reference methods are used to ensure that air quality data is accurate, reliable, and comparable across different regions and times. These are standardised procedures for measuring specific pollutants, stipulated by authorities such as the Environmental Protection Agency (EPA) in the United States or the European Committee for Standardization (CEN) in the European Union.
Data Collection and Analysis
Data from monitoring stations is collected, either manually or automatically, and then analysed to derive meaningful insights. Analysis may involve identifying trends, investigating exceedances of air quality standards, or modelling future scenarios. The data can also be used to inform policies and strategies for air quality management and public health.
Air Quality Index (AQI)
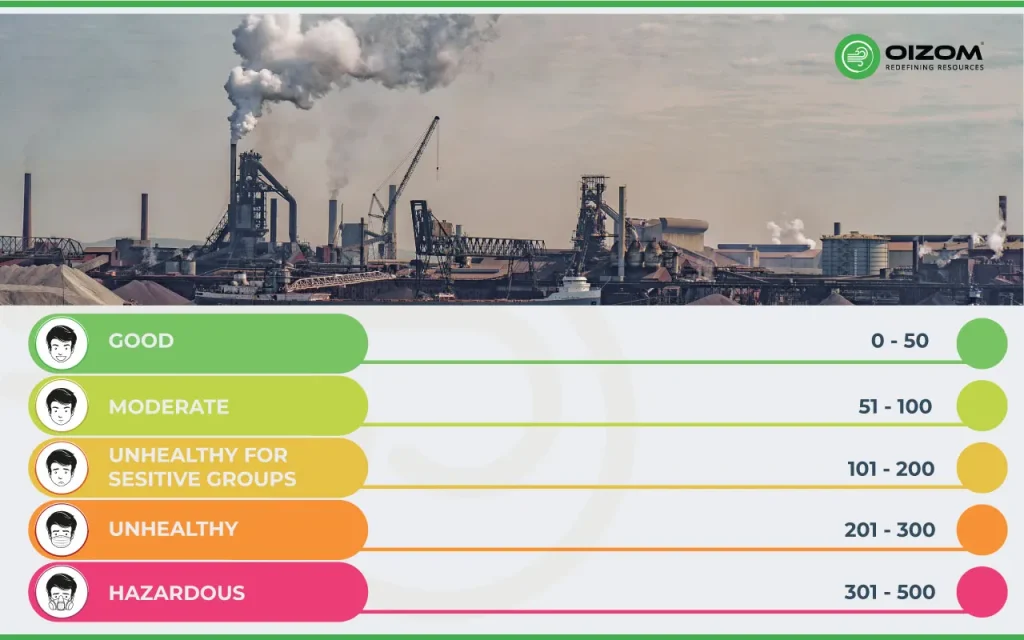
To make air quality data accessible and understandable to the general public, many countries use an Air Quality Index (AQI). The AQI translates complex air quality data into a simple numerical scale, often with associated colour codes and health advisories. For example, the UK’s Daily Air Quality Index ranges from 1 (Low) to 10 (Very High), providing guidance on health implications and suggested actions for different groups, especially vulnerable individuals.
Emerging Technologies and Innovations
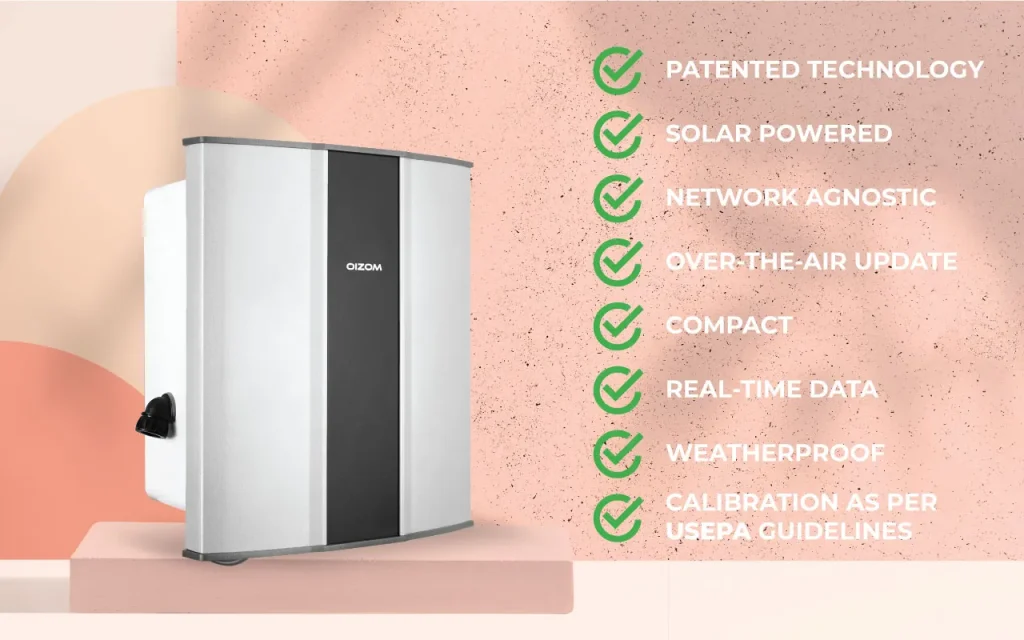
The air quality monitoring field is continually evolving, driven by technological advancements and innovation. Portable monitors, drone-based sensors, satellite imaging, machine learning, and the Internet of Things (IoT) are transforming how we measure air quality, enabling greater coverage, higher-resolution data, and real-time public accessibility.
Real-time monitoring and analysis become increasingly crucial as we move towards a data-driven world. Oizom’s continuous air quality monitoring solutions provide real-time data, presenting a detailed and dynamic picture of air quality changes. These solutions are designed for easy integration, allowing you to access crucial air quality data anytime.
Moreover, in line with the era of digital transformation, Oizom leverages emerging technologies like IoT and machine learning. These technologies aid in delivering superior air quality measurement, forecasting, and management solutions. For instance, Oizom’s portable and drone-based sensors offer extended coverage and high-resolution data, providing you with a comprehensive understanding of air quality at a micro level.
To ensure these insights translate into effective action, it’s important to focus on choosing the most suitable air quality monitor for your environment, based on application, accuracy needs, and deployment location.
With Oizom’s solutions, you can monitor various parameters impacting air quality, including PM10, PM2.5, gaseous pollutants like CO, SO2, NO2, O3, and VOCs, as well as weather parameters like temperature, humidity, and wind direction. The data collected is comprehensive, accurate, and reliable, empowering you to understand and act on the air quality around you.


