Did you know: “The combined effects of ambient air pollution and household air pollution causes around 7 million premature deaths annually”
Air pollution is like the new dinosaur species of the world, it cannot coexist with humans. The only difference is that we still have time to conquer the air pollution and solutions to control it.
What is Measured as Air Quality?
Air quality is an outcome of the complex interaction of several factors involving the chemical reactions, meteorological parameters, and emissions from natural and anthropogenic sources.
How Can You Measure Air Quality?
With AQI (Air Quality Index)
To gain a deeper understanding of How air quality is measured with measurement parameters and Techniques.
Right Now, Let’s see a complete guide to AQI
What is air quality index
MoEFCC describes AQI or Air Quality Index as ‘One Number- One Colour-One Description’ for the layman to judge the air quality within his vicinity.
AQI is an index used to report daily air quality. It tells you how unhealthy the ambient air is and how polluted it can become in the near future. AQI also educates you on what associated health effects might be of concern. It primarily focuses on the adverse health effects you may experience within a few hours or days after breathing unhealthy air.

Air Quality Index is a scale designed to communicate the current air quality status to the people in readily comprehensible terms. It converts the complex air quality data of different pollutants/contaminants into a numerical value (index value), terminology and colour.
The main objective of the AQI is to inform and caution the public about the risk of exposure to daily pollution levels. With an increase in AQI, a large number of the population is exposed to severe health conditions.
What is a good air quality number?
If the air quality number is between 0 and 50 on the AQI, then it’s “Good.” This means it is safe to live or has no risk to health.
How bad is 300 air quality?
If the air quality index is in the 300 range, then it denotes “Hazardous.” It represents unhealthy polluted air and a risk to public health.
What are the colors of the air quality index?
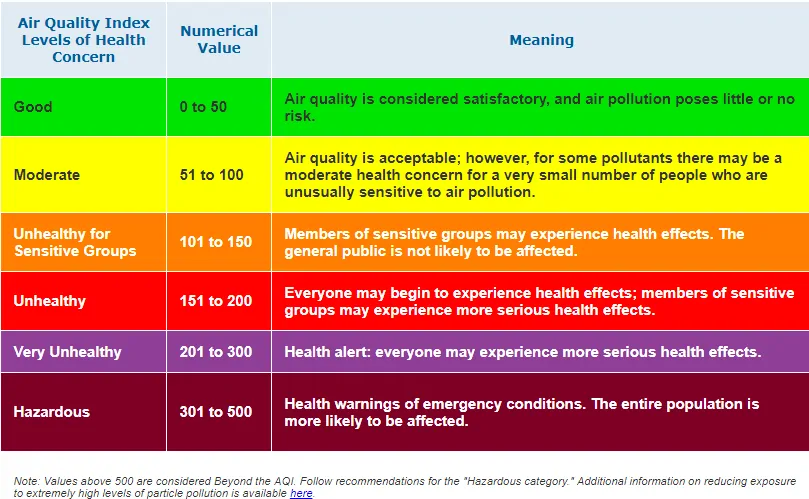
In AQI, you can find different colors to indicate the pollution levels:
Green (0-50): Good
Yellow (51-100): Moderate
Orange (101-150): Unhealthy for sensitive groups
Red (151-200): Unhealthy
Purple (201-300): Very unhealthy
Maroon (301-500): Hazardous
How to read air quality index?
You can read the Air Quality Index by checking the numerical value with their corresponding categories, like Good (0-50 ), Moderate (51-100), and Hazardous (above 300).
Why is AQI Important?
The Air Quality Index (AQI) is an important tool for effectively communicating the state of the air we breathe. It is designed to provide a simple, easy-to-understand representation of air quality levels and the associated health risks. In areas with continuous air monitoring systems, large volumes of data are collected, which can be difficult for the general public to interpret. AQI bridges this gap by indexing the air quality and providing clear, actionable information on how individuals can protect themselves from air pollution.
A broad overview of the high air pollution concentrations or even the frequency of the NAAQS exceedance is not sufficient for the citizens to assess the urban air quality. The general public needs information on the pollution levels and the associated potential health risks of air pollution presented in a simple, understandable format.
There are various continuous air monitoring systems installed in big cities showing the city’s environmental health in different numbers and colours. But the monitored data is in large volumes and does not give a clear picture to the decision-maker or to the common man who wants to know how good or bad the air is?
However, AQI simplifies the information, presenting air quality in terms of unitless numbers and colors, each representing a different category of health risk. These standardized readings also help in making global comparisons easier—for instance, studies like the Top 5 Most & Least Polluted Countries in recent years rely heavily on AQI data to rank nations based on air quality.
Along with indexing the air quality, AQI also provides advice on how one can improve the quality of the air one inhales. This index particularly considers the people sensitive towards air pollution and advises them ways to protect themselves from different health risks posed at various air quality levels.
AQI is all the more important in developing nations like India where the common man is not quite familiar with the technical terminologies and measuring units (like ppm /ppb / or µg/mg3 ). Hence the AQI simplifies the understanding of their air quality by decoding the quality in terms of unitless numbers and colour, with each figure and colour representing a different category of associated health risk.
Doctors and healthcare professionals can also use AQI to predict spikes in respiratory distress and to identify when they should advise patients to take additional precautions. In conclusion, AQI plays a vital role in improving public health by providing critical information on air quality and the associated health risks, allowing individuals to make informed decisions and take appropriate measures to protect themselves and their communities.
Did you know: “An average adult inhales around 11,000 litres of air per day.”
How to calculate AQI
Computing the AQI requires the concentration of a pollutant over a specific period provided by an air quality monitor. For this, you need to have an accurate air quality monitor that works in extreme climate conditions to take preventive actions. The function used to convert air pollutant concentration to AQI varies by pollutant from country to country. The major pollutants are divided into ranges, and each range is assigned a descriptor and a colour code.
Each AQI range has a Standardised public health advisory associated with it. Primarily two steps are involved in developing an Air Quality Index:
Step 1: Creating sub-indices for each pollutant
Step 2: Aggregating (breakpoints) these sub-indices
Segmented linear functions are used to relate each pollutant’s concentration for relating the actual air pollution concentrations (of each pollutant) to a normalised number (i.e., sub-index).
A pollutant’s index value is basically its concentration expressed in terms of percentage of an applicable standard. An index for any given pollutant is its concentration expressed as a percentage of the relevant standard. The maximum value of sub-indices of each pollutant is taken to represent the overall AQI of the location. Breakpoint concentrations are defined by the NAAQS and results of epidemiological studies and depend on indicating the risk of adverse health effects of specific pollutants. Therefore, these breakpoints for each pollutant can vary.
As per Indian AQI, primarily a health-related index is divided into six AQI categories, namely Good, Satisfactory, Moderately polluted, Poor, Very Poor, and Severe.


Each of the above AQI categories represents a different health concern level. EPA (Environmental Protection Agency) has assigned a specific colour to each category to make it easier for people to understand the level of pollution in their communities. For example, the green colour means that conditions are “good and unhealthy for sensitive groups,” while maroon colour means that the environment is hazardous and emergency actions need to be taken.
How to interpret AQI

– Air Quality Index (AQI) helps in explaining how to plan activities around air quality and help us live the healthiest lives possible. Hence, learning to read and interpret the AQI is the first step in engaging with our health and air quality.
– AQI assesses individual air pollutant level in the ambient air. Interpreting AQI may sound complicated, but when broken down it really is quite simple. AQI communicates the air quality in terms of number from 1 to 500. The higher the number, the greater the health risks associated with the air quality. When the level of air pollution is very high, the number will be reported above 300.
– Ideally, when the air quality is good, the AQI is low (0-50), and the colour associated with it is green. As the air quality worsens, the number gets higher, and the colour associated with it becomes a darker shade of red.
Oizom Terminal – A cloud-based data visualization and analytics platform derives the AQI as per the National standards. The parameter wise data from the Oizom Environmental Monitoring Equipments can be seen as below for ease of interpretation.
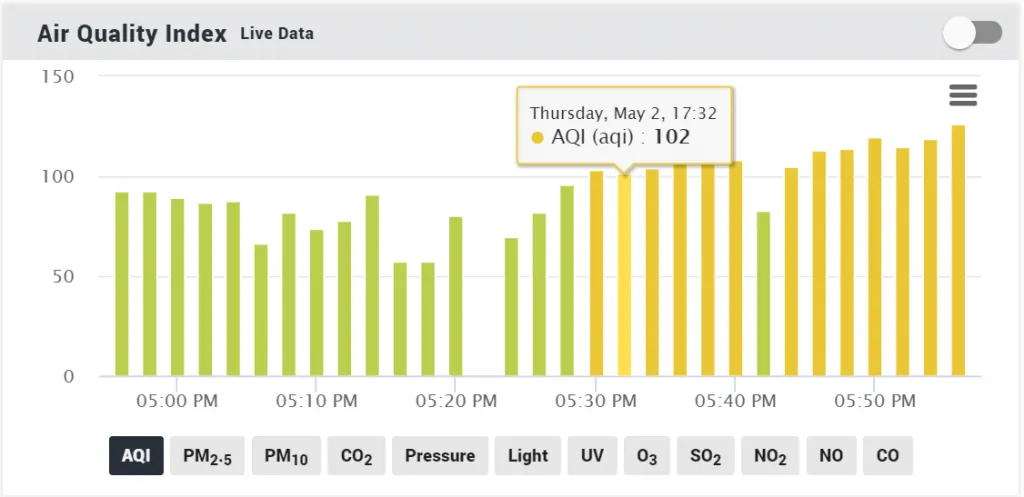
This snapshot depicts the AQI of a particular time, based on the appropriate colour-code and index value from the maximum value of sub-indices of each pollutant.
More info on Oizom Terminal: Visualization & Analytics
Your response to AQI
The AQI fluctuates during the whole day, making it easy for you to plan your day’s activities.
Poor air quality brings many health problems like cardiovascular disease and respiratory problems such as asthma, allergies, pneumonia, and bronchitis. On days when the AQI level is above 101 (yellow), you should take appropriate steps to limit your exposure.
Some precautionary measures/safety tips during the poor air quality days:
– Find out the air quality in your area before planning your day.
– Minimize your exposure by avoiding highly polluted areas like high-traffic, industrial areas, smart cities especially at peak pollution hours.
– Try exercising indoors on days when air quality is poor so that you can benefit from pollution-free air. Contribute to improving long-term air quality by reducing emissions as much as you can. Use public transportation or carpool with your family and friends whenever possible.
OTHERS
It is proposed that for continuous air quality stations, AQI is reported in near real-time for as many parameters as possible. For manual stations, the daily AQI is reported with a lag of one week to ensure manual data are scrutinised and available for AQI.
FAQs
AQI is calculated by measuring key pollutants such as PM2.5, PM10, CO, NO2, SO2, and O3. Each pollutant’s concentration is converted into a standardized scale, and the highest value determines the overall AQI.
Poor AQI can cause respiratory problems, allergies, asthma, cardiovascular issues, and long-term health risks. Sensitive groups, like children, the elderly, and those with pre-existing conditions, are most affected.
AQI values from 0–50 are considered good, indicating clean air. 51–100 is moderate, 101–150 is unhealthy for sensitive groups, 151–200 is unhealthy, 201–300 is very unhealthy, and above 300 is hazardous.

