
Summary
As cities expand, pollution exposure becomes an embedded urban risk. Air quality data helps planners move beyond reactive environmental control towards proactive, evidence-based design. By mapping pollution patterns, identifying hotspots, and integrating atmospheric intelligence into traffic systems, zoning frameworks, and smart city strategies, cities can reduce exposure, improve resilience, and build healthier urban environments. This blog explores how air quality data functions as an invisible infrastructure layer shaping modern urban planning decisions.
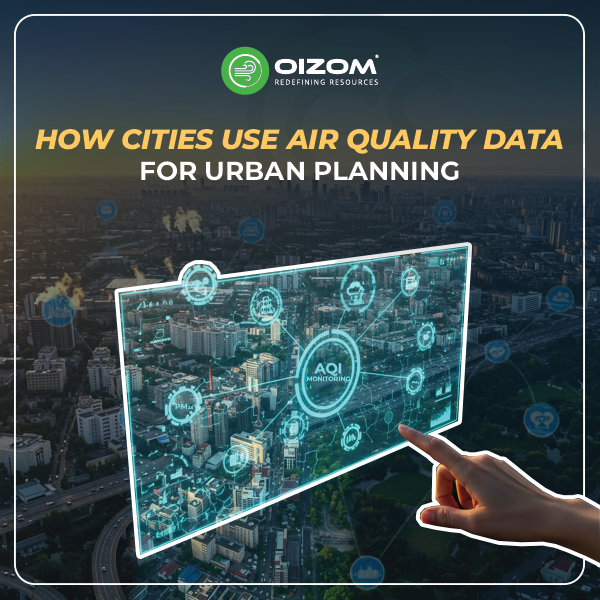
How Cities Use Air Quality Data for Urban Planning
Urban planning has traditionally focused on tangible infrastructure such as buildings, roads, and transport networks. In contrast, air has rarely been treated as a planning input.
This growth increases pollution exposure. Poor air quality harms health, reduces productivity, and deepens inequality. According to the World Health Organization’s data, nearly 99% of people breathe air that exceeds safe limits. These impacts were historically excluded from planning frameworks.
Today, air quality data enables cities to map pollution risks, shifting the paradigm from regulatory compliance to a core design tool.
Types of Air Quality Data Cities Rely On
Urban planners rely on multiple layers of environmental data to understand pollution exposure and risk.
Pollutant Concentration Data
Cities typically monitor a variety of pollutants, including PM₂.₅, PM₁₀, NO₂, O₃, SO₂, and CO. Among the many pollutants that can affect public health, PM₂.₅ is especially troublesome because these small particulates can penetrate deeply into the lungs and bloodstream when inhaled. Monitoring PM₂.₅ helps identify neighbourhoods facing chronic health risks.
Temporal Patterns
Pollution levels do not remain constant over time; they change hourly, seasonally, and with the weather. For example, peak traffic hours typically result in large spikes in NO₂ concentrations. Winter temperature inversions can trap pollutants near the ground, while construction activity can create temporary surges in PM concentrations. Temporal data reveals when exposure peaks occur.
Spatial Distribution
Cities use spatial mapping tools to track pollutant concentrations across urban areas. High-traffic routes often form pollution corridors with higher concentrations. Spatial mapping provides planners and policymakers with hyperlocal exposure data rather than a citywide average.
Meteorological and Dispersion Data
Weather and wind greatly influence pollutant dispersion. For example, prevailing wind direction determines how industrial emissions disperse and which neighborhoods are affected. By understanding pollutant dispersion patterns using meteorological and dispersion data, cities can predict how new developments will increase pollutant exposure in surrounding neighbourhoods.
Together, these datasets create a multi-dimensional understanding of urban air quality, one that informs planning decisions beyond environmental reporting.
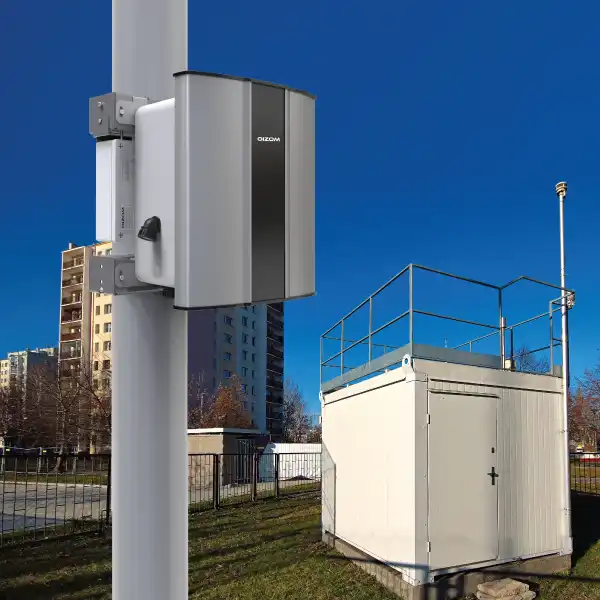
How Cities Collect Air Quality Data at Scale
Reference-grade monitoring stations provide high-accuracy, regulatory-grade pollutant measurements in many metropolitan areas. In addition to reference-grade monitoring stations, municipalities can use networked sensors to gather hyperlocal data from neighbourhoods.
Data from mobile measurements can enhance the granularity of citywide measurements. Satellite measurements provide a more regional context. Today’s cloud computing systems consolidate various data sources into a single platform that integrates real-time visualisation, historical trend analysis, and multi-site comparison.
Effective planning requires continuous, distributed monitoring systems that capture spatial and temporal pollution variability.
Using Air Quality Data to Identify Urban Pollution Hotspots
Residents living near major transport corridors or industrial zones often face higher exposure levels. Hotspots are determined by analyzing long-term exceedances and short-term peaks. Chronic exposure occurs when PM₂.₅ concentrations remain high for extended periods, while acute exposure occurs when PM₂.₅ concentrations are very high for a limited period.
It is also important to note that hotspots are often located in areas with populations most vulnerable to pollution, including low-income neighbourhoods and informal settlements. Low-income and marginalized communities often face disproportionate exposure due to proximity to industrial zones and limited relocation options.
Air quality mapping exposes inequitable pollution burdens. Additionally, planners will be able to use visualisation techniques to identify areas with increased pollution and those requiring immediate intervention, such as by implementing zoning modifications, rerouting vehicular traffic, and improving green buffers.
How Air Quality Data Influences Key Urban Planning Decisions
Planning for urban environments affects the distribution of environmental risk. Obtaining air quality data can support more responsible decisions.

Road Networks and Traffic Planning
Road congestion is a major source of NO₂ and particulate matter in urban areas. Planners can analyze pollution levels in main corridors and adjust their design to reduce transportation exposure.
Planners can use different strategies, like creating alternative routes for heavy trucks, establishing low-emission zones, fine-tuning traffic signal timing, and increasing public transportation. They can also use real-time data on pollution levels to adjust how they manage traffic on roadways.
Zoning and Land-Use Planning
Zoning decisions determine the location of housing, schools, hospitals, and industrial areas, and establish high-traffic-volume areas.
Air quality maps help planners make evidence-based decisions to establish buffer zones that reduce residential exposure from development. Also, the maps will assist local governments in deciding what and where to allow industrial development, how to design mixed-use development, and where to allow residential development first.
Green Spaces and Urban Design
Urban planners have begun to use green infrastructure to mitigate urban pollution. Green infrastructure, such as urban forests, tree-lined streets, and greenbelts along highways, helps reduce air pollution and improve local microclimates.
Cities use air quality data to determine where their green interventions will have the most significant impact. Ventilation corridors, which provide open spaces aligned with natural wind direction, can also be incorporated into planning to improve pollutant dispersion.
Air Quality Data in Smart City and Climate Action Plans
Air quality monitoring has become an integral component of smart city systems. Dashboard metrics provide a real-time view of air quality and help cities respond more quickly to exceedances. When air quality data is integrated into traffic systems, public advisories, and emergency protocols, it increases the city’s responsiveness to air quality issues.
Climate action plans use air quality and greenhouse gas reduction data to determine if infrastructure improvements will reduce both air pollution and climate change impacts. Common co-benefits of electrifying transportation and reducing industrial emissions can be effectively measured using data from energy efficiency programs. Cities can use new analytical tools and predictive models to forecast how future infrastructure projects will impact air pollution before they are built.
As digital governance continues to develop, local governments will also be able to use this environmental information as part of their operational intelligence.
From Data to Policy: How Cities Turn Insights into Action
Insights gained from monitoring air quality can be utilized to formulate and implement:
- Emission standards and compliance enforcement
- Construction dust control regulations
- Transport restrictions during high-pollution episodes
- Industrial permitting processes
- Public health advisories
Using evidence-based policymaking adds legitimacy to regulations and builds trust from various stakeholders. Interventions supported by data are defensible and more transparent.
In addition, over the long term, continuous air quality monitoring helps cities assess whether policy measures are effective and provides the basis for adaptive governance.
What Effective Air Quality–Driven Urban Planning Looks Like
Cities that integrate air quality into urban infrastructure share several common characteristics, such as:
- Continuous, citywide monitoring networks
- Centralized data platforms with real-time visibility
- Cross-department collaboration between planning, transport, health, and environment agencies
- Predictive modeling capabilities
- Public transparency and reporting
These cities do not simply respond to air pollution crises; they intentionally design and construct their infrastructure with air quality in mind, treating air as an integral aspect of urban space rather than a consequence of development.
Transitioning to an integrated environmental design will shift urban planning from reacting through mitigation to designing for prevention.
Conclusion
Although invisible, air quality has measurable structural impacts on urban systems. Making environmental intelligence a necessity for long-range urban investment. Air quality impacts health outcomes, economic productivity, climate change resilience, and social equality. Future urban planning no longer relies solely on planning roads and buildings, but also on understanding how air movement and buildup in cities and their communities impact. Cities that view air quality as a core infrastructure component rather than an environmental issue will be better prepared to develop resilient, healthy, and equitable urban structures.
FAQs
PM₂.₅ is particularly important due to its health impact. NO₂ helps assess traffic-related emissions, while spatial and temporal trend data provide insight into exposure patterns and long-term risk.
Yes, data supports buffer zones between residential and industrial areas, informs placement of schools and hospitals, and guides industrial permitting decisions.
Real-time monitoring integrates with traffic systems, digital dashboards, predictive modeling tools, and climate action frameworks, enhancing responsive governance.
It identifies sources and hotspots, guides targeted interventions, informs policy decisions, and enables cities to measure the effectiveness of mitigation strategies over time.