Summary of Blog
Wondering how we know what’s really in the air we breathe? This blog breaks down the world of Air Quality Monitoring Stations (AQMS), from old-school manual setups to cutting-edge smart sensors. Whether you’re new to air quality monitoring or managing environmental projects, this guide helps you understand the different types of stations, how they work, and when to use each.
We also dive into real-life scenarios where the right monitoring setup made all the difference, like tracking pollution near construction sites or capturing traffic emissions in crowded urban zones.
You’ll learn the key components that make these stations tick, what to consider when placing them, and how smart technologies like AI calibration are making monitoring more accessible and reliable.
In short? If clean air matters to you, and it should, this blog is your go-to for understanding how data drives better air and better decisions.
What are Air Quality Monitoring Stations?
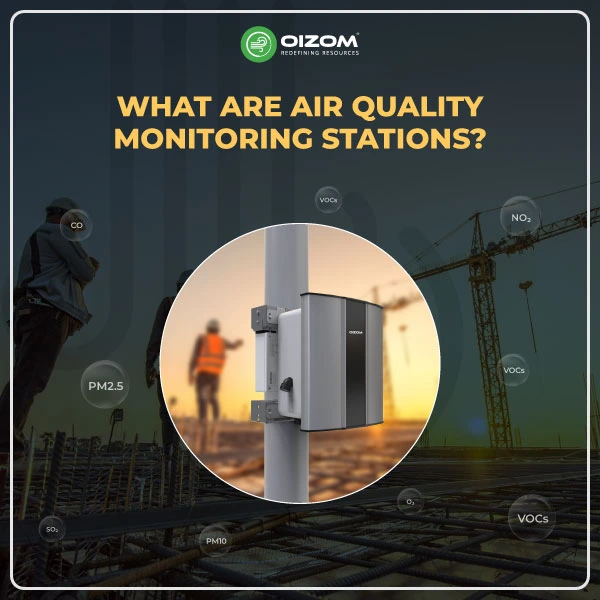
How do we really know if the air around us is safe to breathe? That’s exactly what Air Quality Monitoring Stations (AQMS) are built to answer.
Think of them as the nerve centers of our environment, quietly collecting data on pollutants like PM2.5, PM10, NO₂, SO₂, CO, O₃, and VOCs. Whether placed near traffic-heavy roads, industrial zones, or quieter residential areas, these stations give us real-time insights into what’s in the air and how it changes over time.
But here’s where it gets interesting for environmental professionals like us. AQMS aren’t one-size-fits-all. From manual setups that collect 24-hour averages to automated real-time systems using technologies like Beta Attenuation Monitors (BAM), Tapered Element Oscillating Microbalance (TEOM), or chemiluminescence analyzers, or sensor-based technologies, each system is designed with specific use-cases and accuracy levels in mind. Did you know this? Air pollution is identified as a top global risk.
In this blog, we’ll unpack how these stations work, the technologies behind them, how data is processed and reported, and why their proper placement and upkeep matter more than most people realize. If you’re working in air quality or environmental monitoring, understanding AQMS is key to interpreting data that drives regulations, health advisories, and climate action. Let’s dive in.
Types of Air Quality Monitoring Stations
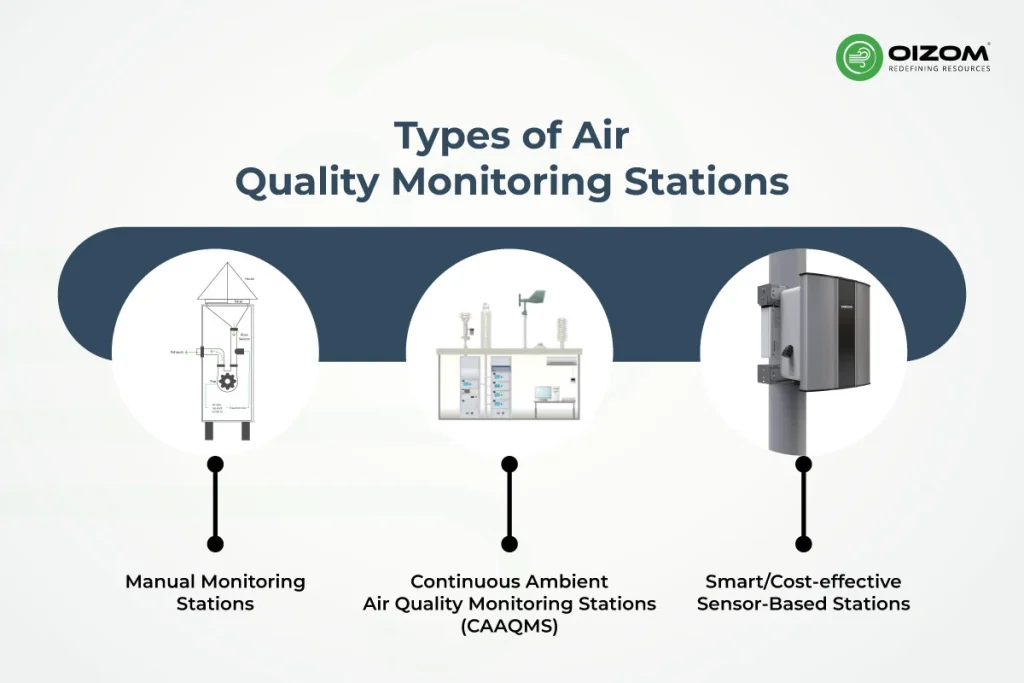
Not all air quality monitoring stations are built the same, and that’s for a good reason. Depending on the objective, scale, and regulatory requirements, different types of AQMS are deployed. Let’s break them down into three major categories: Manual, Continuous, and Smart/Low-Cost Monitoring Stations.
Manual Monitoring Stations
These are the first-generation setups, widely used for baseline studies and compliance checks.
- They typically use filter-based gravimetric sampling to measure particulate matter. The filters are collected manually and sent to labs for analysis.
- Gas sampling is done via absorbent media and wet-chemistry techniques.
- While highly accurate, they’re time-intensive (usually 24-hour averages) and lack real-time insights.
Manual stations are still essential in developing regulatory frameworks and calibrating newer technologies.
Continuous Ambient Air Quality Monitoring Stations (CAAQMS)
These are your second-generation reference-grade systems, automated and built for high accuracy.
- Technologies include Beta Attenuation Monitors (BAM) or TEOM for PM, and chemiluminescence, UV fluorescence, and NDIR analyzers for gases.
- They provide real-time data, often every 1–15 minutes, and meet national/international standards like US-EPA or EN.
- Data from CAAQMS is directly used for regulatory compliance, forecasting models, and public health advisories.
Though reliable, they are expensive, bulky, and require trained personnel and regular calibration.
Smart/Cost-effective Sensor-Based Stations
Enter the third-generation monitors, which are compact, scalable, and connected.
- These stations use electrochemical, NDIR, PID, and laser scattering technologies.
- While not always regulatory-grade, they excel in spatial resolution, networkability, and cost-efficiency.
- They’re often used to fill data gaps between reference stations, identify micro-hotspots, or conduct citizen science and industrial fenceline monitoring.
Oizom’s Polludrone is a leading example in this segment. It’s a smart, sensor-based ambient air quality monitoring system engineered for high data accuracy through a combination of precise sensing and advanced correction algorithms. Equipped with multi-gas capabilities, laser-based PM sensing, and dynamic environmental compensation, Polludrone ensures reliable data even under varying climatic conditions.
What sets Polludrone apart is its use of AI and machine learning-based calibration models that enhance raw sensor output, aligning it closely with reference-grade readings. The system is also IoT-enabled, allowing seamless remote access, real-time alerts, and integration with platforms like Envizom for advanced analytics.
These smart stations, like Polludrone, are increasingly being used to:
- Fill the gaps between fixed reference monitors
- Map hyperlocal pollution patterns
- Enable industrial perimeter monitoring
- Support policy planning and urban interventions
With proper calibration and AI-based correction algorithms, these stations are increasingly reliable for indicative measurements.
Quick Comparison Table: Types of Air Quality Monitoring Stations
| Type of Station | Real-Time? | Accuracy | Cost | Use Cases |
|---|---|---|---|---|
| Manual | ❌ | High | Low | Compliance, Baseline studies |
| CAAQMS | ✅ | Very High | High | Regulations, Health Advisories |
| Smart Sensor | ✅ | Variable (but improving) | Low | Hotspot detection, Research, Citizen Science |
Real-Life Examples: How Air Monitoring Stations Work in Action
Let’s make this real. You’ve probably read about air quality monitors and how they collect data, but how do they actually help in day-to-day decision-making?
Imagine a city expanding its airport. With heavy construction underway, dust and gas emissions are on the rise. Planners need a way to monitor pollution levels without delay. Installing large, expensive equipment may not be practical across the entire site. That’s where compact, sensor-based monitoring stations come in. They’re fast to deploy and provide real-time updates, which help project teams take immediate action if pollution crosses safe levels.
In another case, a residential area near a busy highway wants to understand traffic pollution better. A single reference-grade monitor can’t capture variations across different lanes and intersections. But by installing multiple small-scale sensor units, the local municipality gets a clear picture of where interventions are most needed, like rerouting traffic or planting green buffers.
These kinds of examples show how different types of air quality monitors serve different needs. Sometimes, you need high precision from a reference monitor. Other times, it’s about capturing trends across a wide area quickly and affordably. The goal is to match the right technology with the right problem.
And that’s the real power of air quality monitoring: it’s not just about numbers on a screen. It’s about enabling smarter, faster, and more localized environmental decisions.
Pros and Cons of Different Air Quality Monitoring Stations
Each type of air quality monitoring station comes with its own set of strengths and trade-offs. Choosing the right one depends on your objectives, regulatory compliance, research, or large-scale mapping.
Manual Stations
Pros:
- Highly accurate for long-term data and lab validation
- Useful for regulatory reporting and baseline studies
Cons:
- No real-time data
- Labor-intensive and time-consuming
- Limited temporal resolution (e.g., 24-hour averages)
Continuous Monitoring Stations (CAAQMS)
Pros:
- Real-time, high-precision data
- Uses reference-grade analyzers like BAM, TEOM, and chemiluminescence
- Regulatory-compliant, ideal for public health and policy use
Cons:
- Expensive to install and maintain
- Requires skilled operators and calibration
- Limited spatial coverage due to cost and size
- The cost is too high
Smart / Low-Cost Sensor Stations
Pros:
- Compact, scalable, and cost-effective
- Offers dense spatial coverage and quick deployment
- AI-based calibration improves data reliability
- Ideal for microenvironmental studies and hotspot mapping
Cons:
- Not regulatory-grade by default
- Sensor performance is affected by humidity, temperature, and cross-sensitivity
Worried about humidity messing with your dust data? You’re not alone; high relative humidity (especially above 80%) is a known troublemaker for PM sensors using laser scattering. When RH hits close to 100%, things like fog or mist can fool the sensors, causing water droplets to be counted as dust particles. That means inflated PM readings and misleading reports.
But with Oizom Dustroid, you can leave those worries behind. It’s equipped with a heated inlet that dries the air before it reaches the sensor. No more confusion between moisture and real dust particles, just accurate, reliable data, no matter the weather. Sea breeze, monsoon humidity, or early morning mist, Dustroid has it covered.
- Requires robust data correction and periodic calibration
No single type fits all use cases. A hybrid approach, combining reference and sensor-based systems, offers the best balance between accuracy, coverage, and cost-efficiency.
Key Components of an Air Quality Monitoring Station
An air quality monitoring station is more than just a sensor in a box. It’s a careful design setup of hardware and software designed to ensure reliable, real-time environmental data collection and reporting. Here’s what goes into building one:
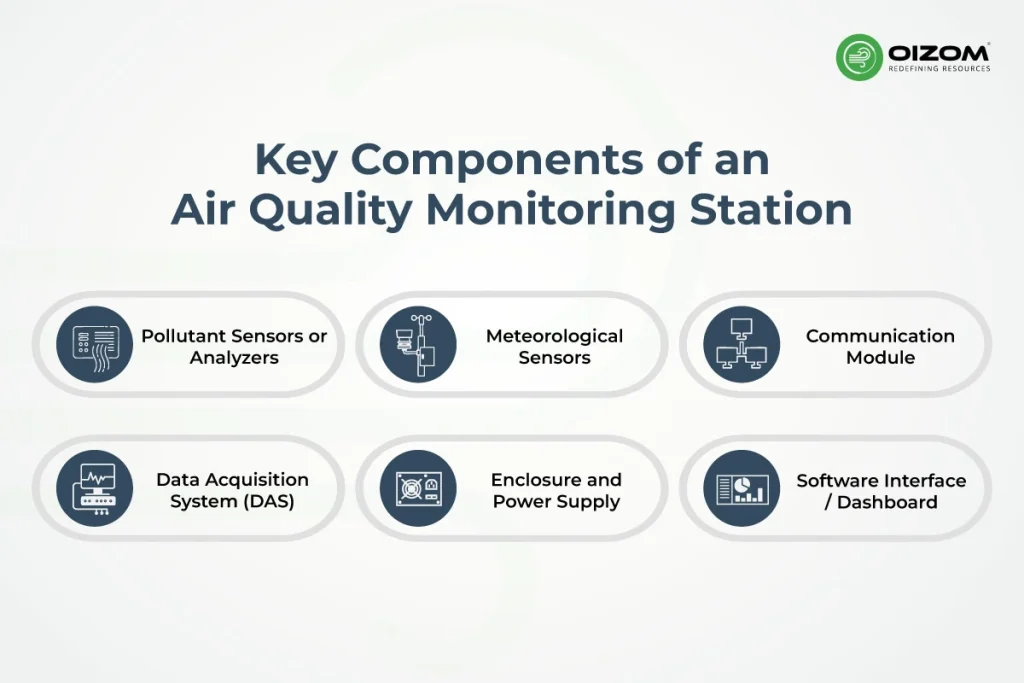
Pollutant Sensors or Analyzers
The core of the station is responsible for detecting and quantifying pollutants.
- Reference-grade analyzers (BAM, TEOM, chemiluminescence, UV fluorescence) offer high-accuracy readings for regulatory use.
- Sensor-based systems use electrochemical (for gases), NDIR (for CO₂), PID (for VOCs), and laser-based optical sensors (for PM1, PM2.5, PM10, and PM100).
- High-end systems may include calibration cells or dual-sensor redundancy for cross-validation.
Data Acquisition System (DAS)
Acts as the brain of the station.
- Interfaces with sensors, timestamps the data, and performs initial error checks.
- Includes memory storage, buffering, and preprocessing (averaging, filtering, etc.).
- Runs onboard algorithms for sensor drift correction or climate compensation.
Meteorological Sensors
Essential for interpreting pollutant behavior.
- Tracks temperature, humidity, wind speed and direction, rainfall, and solar radiation.
- Supports dispersion modeling, pollutant source attribution, and climate-adjusted calibration.
Enclosure and Power Supply
- Enclosures are typically IP66 or higher, UV-resistant, and thermally controlled.
- Power sources include solar panels, battery backups, or grid connectivity to ensure uptime in remote or off-grid locations.
- Temperature and humidity regulation inside the enclosure maintains sensor longevity.
Communication Module
Ensures real-time data accessibility.
- Connectivity options: GSM/4G, Wi-Fi, LoRaWAN, NB-IoT, or Ethernet.
- Data is pushed to a centralized cloud server or edge-based analytics system for visualization, reporting, or automated alerts.
Software Interface / Dashboard
Translates raw data into actionable insights.
- Enables trend analysis, threshold alerts, diagnostics, and regulatory reporting.
In advanced systems like Oizom’s Envizom, users can also visualize an air quality heatmap and device health remotely.
Guidelines for Siting and Installing Air Quality Monitoring Stations
Siting an air quality monitoring station isn’t just a logistics task; it’s a science-backed decision that defines the credibility of your data. Poor siting can lead to biased readings, underestimation of pollutant loads, or false alarms.
Let’s break down the key technical considerations:
1. Define the Monitoring Purpose First
- Urban background, roadside, industrial, or residential exposure, each use case needs a distinct location strategy.
- For source-specific studies, proximity to the emission point is essential. For general air quality, aim for a location with minimal local interference.
2. Height, Orientation, and Positioning
- Mount the inlet at 1.5 to 5 meters (approx) above ground level for ambient sampling.
- Avoid placement under overhangs, near walls, or directly above surfaces that radiate heat or reflect pollutants.
- Ensure the inlet faces predominant wind directions to capture representative samples.
Want to see how Oizom’s Polludrone is perfectly set up at Bhogapuram Airport construction in Vizianagaram, Andhra Pradesh? Our latest case shows how it accurately measures air quality along with weather conditions, without any drawbacks. Take a look to learn more in our latest case study.
3. Obstacle-Free Zone
- Maintain a 270° clear air path with no obstructions within a radius of 2–5 meters.
- Avoid placing stations near trees, vents, traffic signals, or reflective glass structures, as they can affect airflow or gas dispersion.
4. Compliance with Siting Standards
- Follow US EPA, EU (EN 12341), or CPCB India guidelines, which include minimum distances from roads, buildings, and emission sources.
- If deploying a sensor-based system like Oizom’s Polludrone, adjust siting to balance microenvironment relevance with data accuracy.
- Proper location selection is critical for optimised data collection. It varies as per the purpose of the project. According to the U.S. EPA QA handbook (Vol II, Section 6.0 Rev.1), the selection of locations should be based on monitoring purposes.
5. Site Infrastructure and Maintenance Access
- Ensure a stable power supply, network connectivity, and physical security of the device.
- Plan for ease of periodic calibration, sensor replacement, and data retrieval (if offline).
Proper siting isn’t optional; it’s foundational. The better the placement, the more reliable your air quality data will be for trend analysis, health risk modeling, and regulatory action.
Conclusion
Air Quality Monitoring Stations are essential tools in understanding and managing the air we breathe. From manual sampling to advanced sensor-based systems, each type serves a specific purpose, whether it’s regulatory compliance, public health alerts, or microenvironment mapping.
Technically, accurate air quality data relies on the right combination of sensor technology, proper siting, environmental compensation, and regular calibration. With pollutants like PM1, PM2.5, NO₂, SO₂, O₃, and VOCs being measured in real time, these stations form the foundation of data-driven action.
Looking ahead, the future of air quality monitoring is moving toward integrated hybrid networks, blending reference-grade accuracy with the spatial coverage of smart sensor systems. With AI-driven calibration, IoT connectivity, and cloud-based analytics, we’re entering an era of faster, more responsive air quality intelligence.
In a world facing rising pollution levels, these stations aren’t just monitoring tools; they’re decision-making enablers. As technology evolves, so will our ability to build cleaner, healthier environments with greater confidence.

